
 Faces Price Decline Despite Unprecedented Network Growth")
Key Takeaways
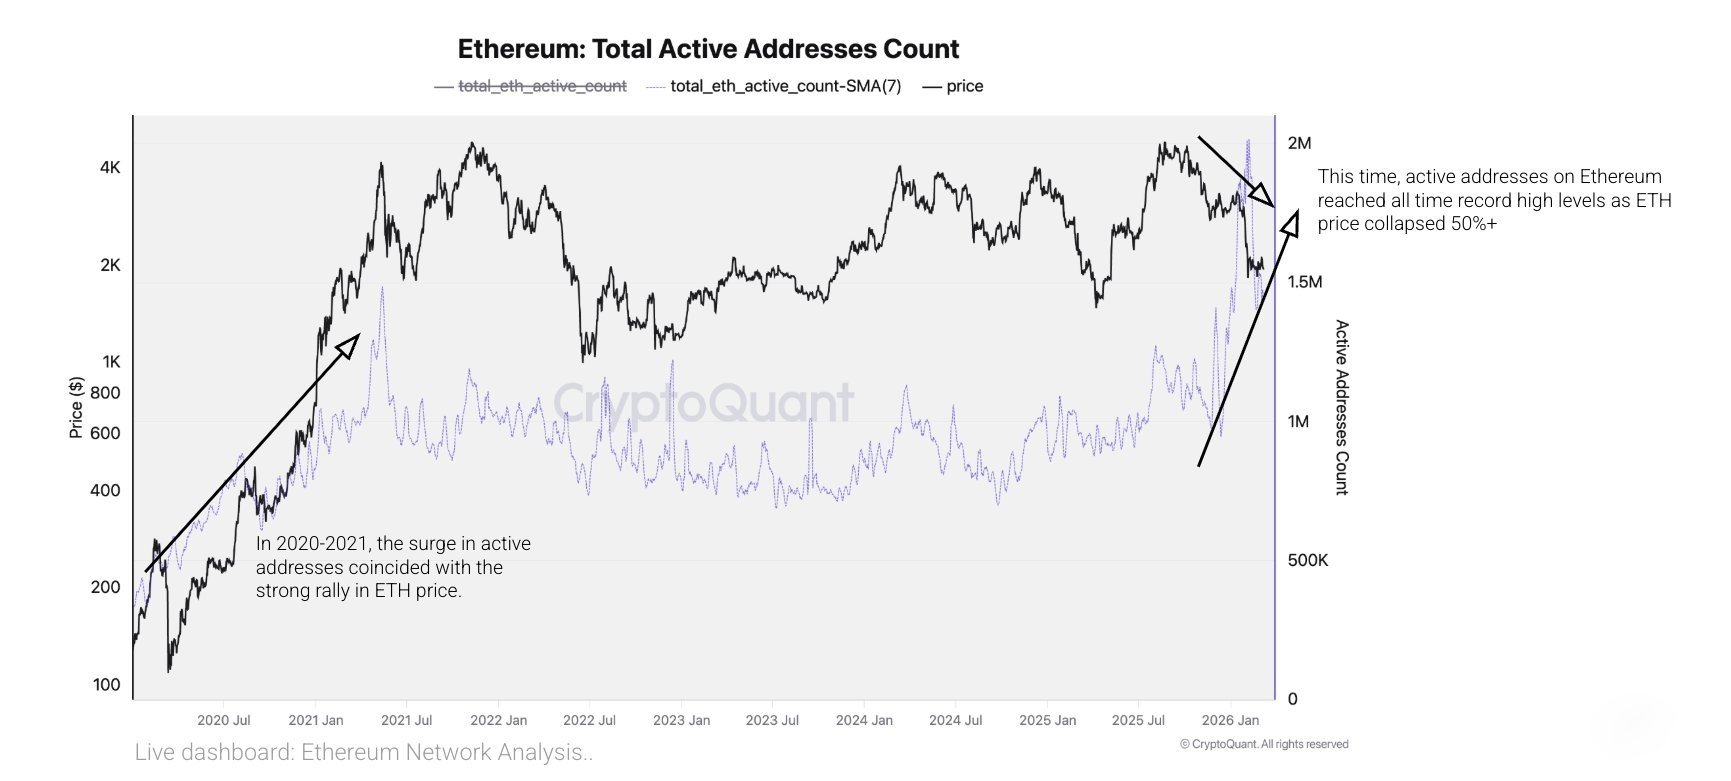
- Daily active addresses on Ethereum reached approximately 2 million in February 2026, exceeding previous 2021 bull run records
- Despite surging network usage, ETH has declined approximately 30% in the last six months
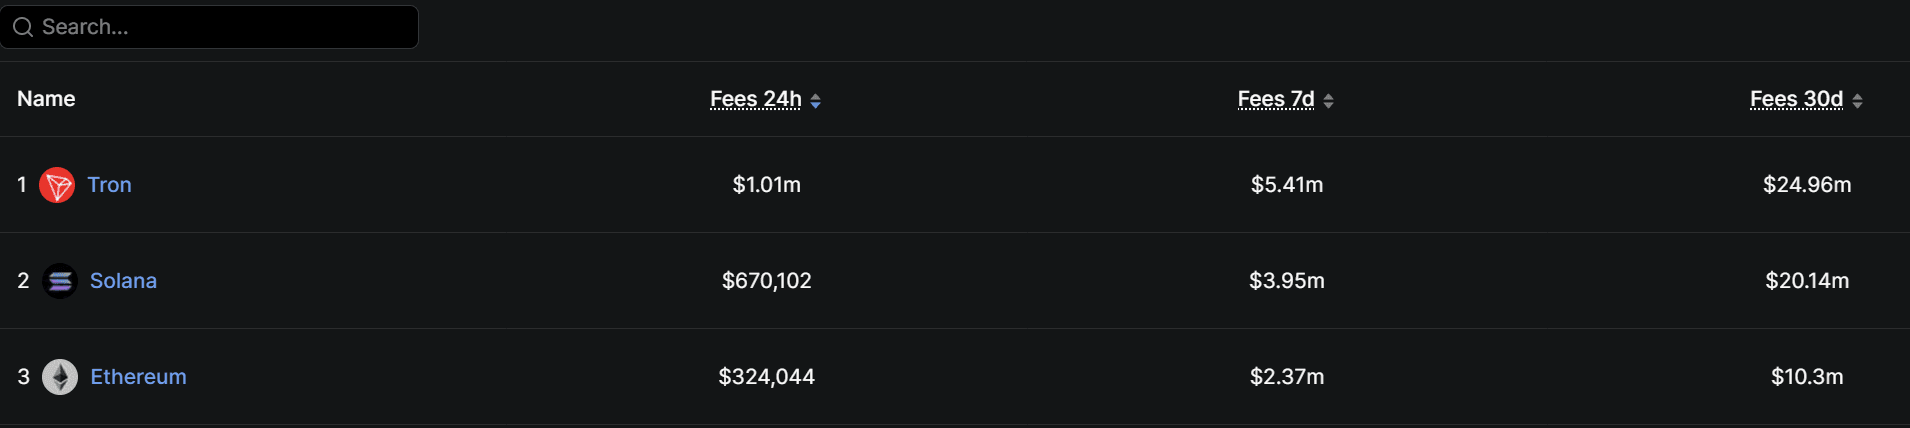
- In 30-day transaction fee rankings, Ethereum places third, trailing both Tron and Solana
- Base and other layer-2 solutions are generating higher revenue than Ethereum’s main chain
- On March 10, Ethereum spot ETFs recorded $12.59 million in total net inflows, with no outflows reported across any of the nine funds
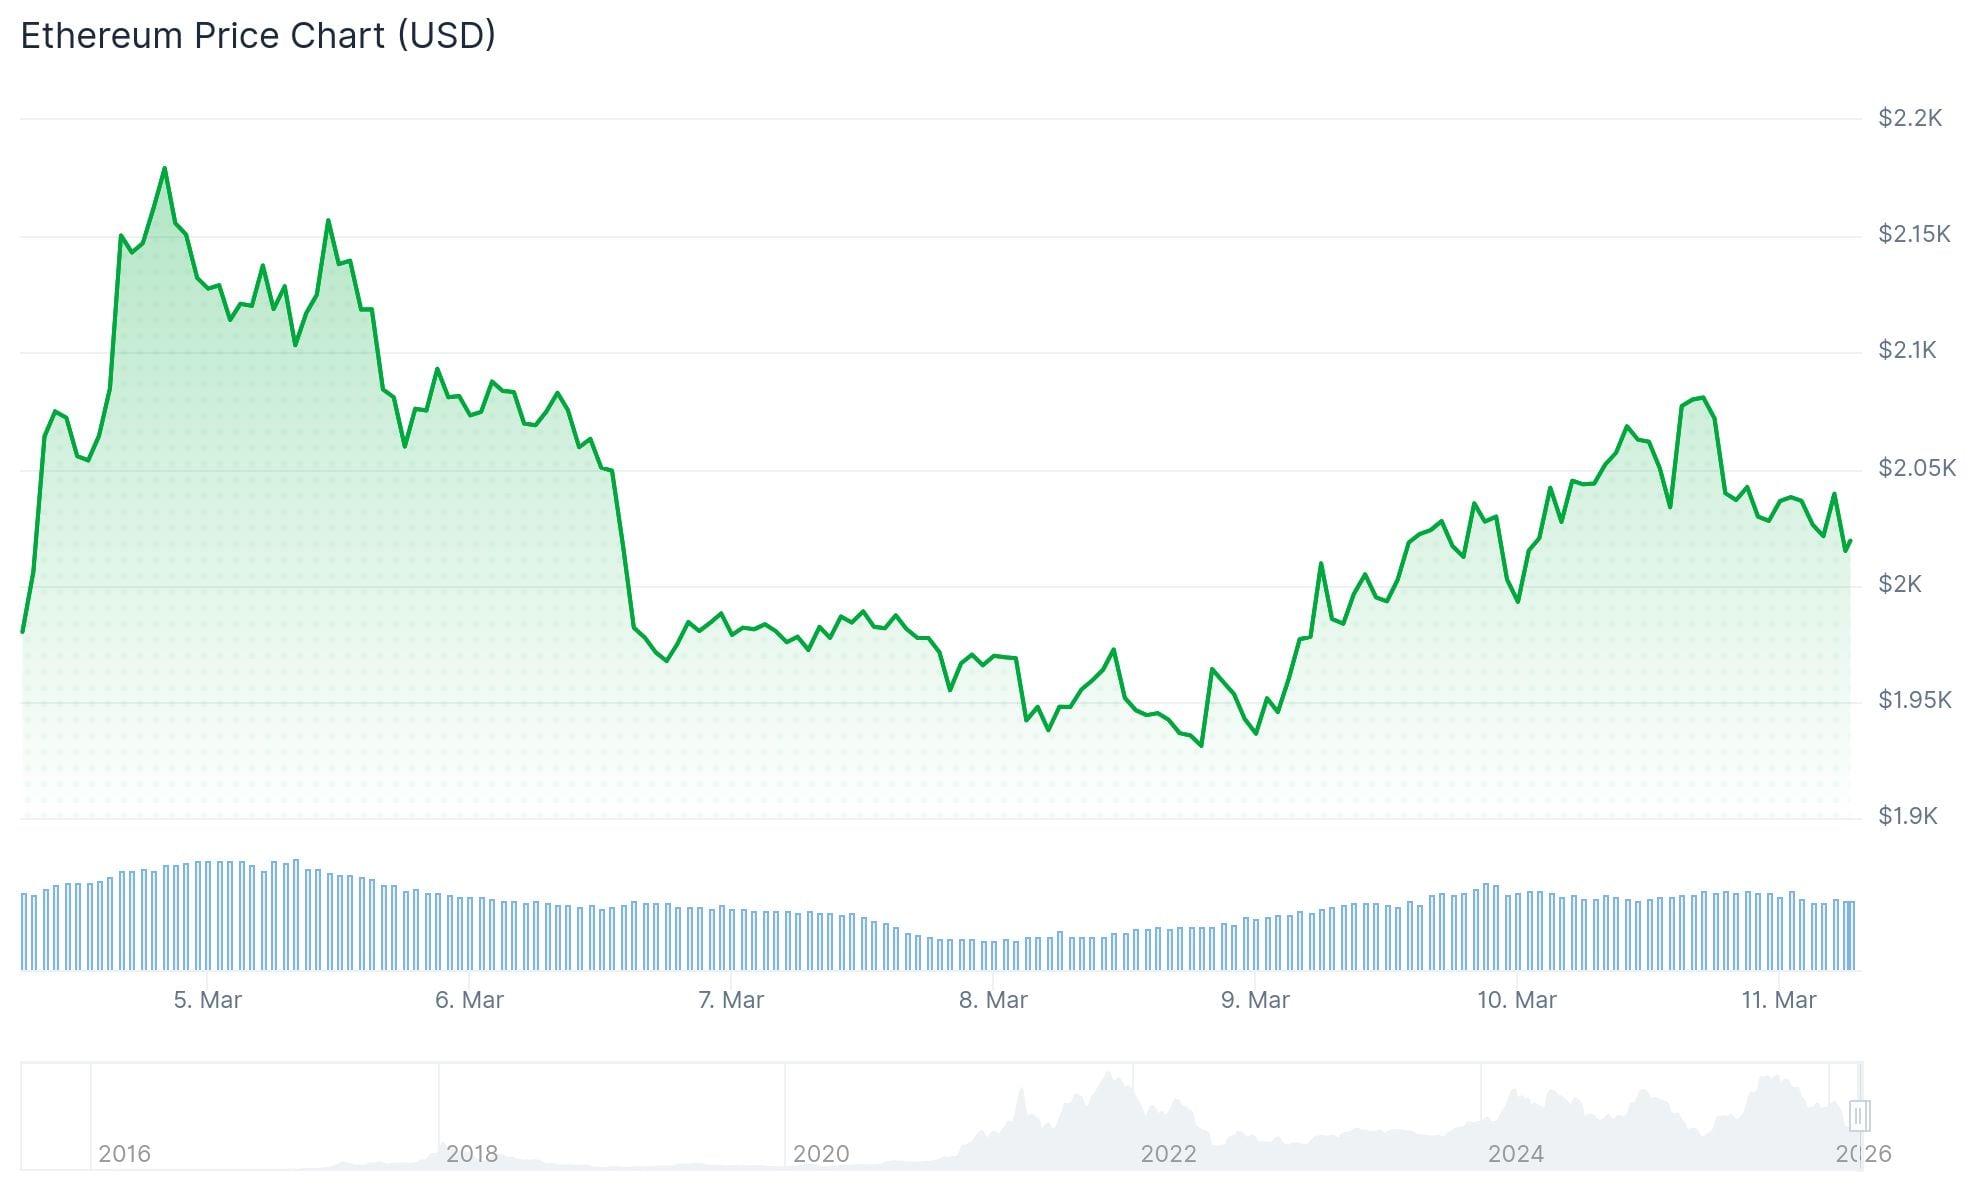
Ethereum’s network utilization has reached unprecedented levels. However, ether (ETH) prices tell a different story.
According to a March 10 analysis from blockchain data provider CryptoQuant, Ethereum’s daily active addresses approached 2 million during February 2026. This figure exceeded the highest levels observed during the 2021 cryptocurrency boom.
Daily smart contract interactions surpassed 40 million. Token transfer volumes similarly reached new heights. Network activity encompasses decentralized finance protocols, stablecoin transactions, and automated smart contract executions.
Despite this, ETH has experienced a roughly 30% price decline over the preceding six-month period. This diverges sharply from historical trends where increased blockchain usage typically correlated with upward price momentum.
CryptoQuant attributes this phenomenon to capital flow dynamics rather than usage metrics. Analysis of exchange flows reveals ether deposits to trading venues outpacing bitcoin deposits, indicating heightened selling activity.
Ethereum’s realized capitalization has exhibited negative growth over a one-year timeframe. This metric suggests net capital withdrawal from the ecosystem.
Fee Revenue Competition Intensifies
Ethereum faces increasing pressure in fee generation. According to DefiLlama data, Ethereum produced approximately $10.3 million in transaction fees during the previous 30 days. Tron dominated with nearly $25 million, while Solana secured second position at roughly $20 million.
Regarding protocol revenue specifically, Ethereum ranked fifth with only $1.22 million. Notably, Base—a layer-2 scaling solution developed by Coinbase utilizing Ethereum infrastructure—generated approximately triple the protocol revenue of Ethereum’s primary layer during this timeframe.
Layer-2 platforms execute transactions off the main chain and remit modest settlement fees to Ethereum. This architectural approach distributes economic value throughout the broader ecosystem instead of consolidating it on the base protocol.
Ethereum maintains dominance in stablecoin infrastructure, hosting approximately $162 billion in stablecoin market capitalization—roughly 52% of the worldwide total. Yet this leadership position hasn’t driven corresponding value appreciation for ETH tokens.
ETH Price Projections and ETF Inflow Data
Cryptocurrency forecasting platform CoinCodex projects ETH could surpass $3,000 by May 2026. Their algorithmic model indicates prices should remain above $2,000 throughout most of the year, with potential peaks approaching $3,673.
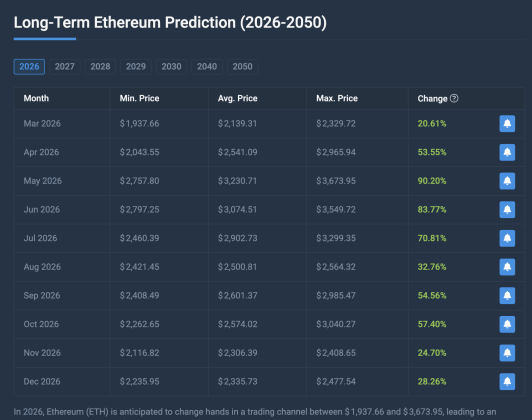
Reaching this upper target from present valuations would constitute approximately 90% appreciation. The December 2026 projection stands at around $2,477, representing a potential 28% increase.
March 10 saw Ethereum spot exchange-traded funds attract combined net inflows totaling $12.59 million. Notably, all nine ETF products registered zero net outflows for that trading session.