
 Faces Critical Test at $1,900 Following Jeffrey Wilcke’s $157M Transfer")
TLDR
- Co-founder Jeffrey Wilcke deposited 79,176 ETH (approximately $157M) to Kraken, triggering market concerns
- Ethereum has declined nearly 8% from March 6, bottoming at $1,912
- Current trading remains beneath $2,000 and the 100-hour Simple Moving Average
- Whale wallets holding 100K–10M ETH continue purchasing despite broader market anxiety
- Critical support zone exists between $1,900–$1,920; further decline could push toward $1,800
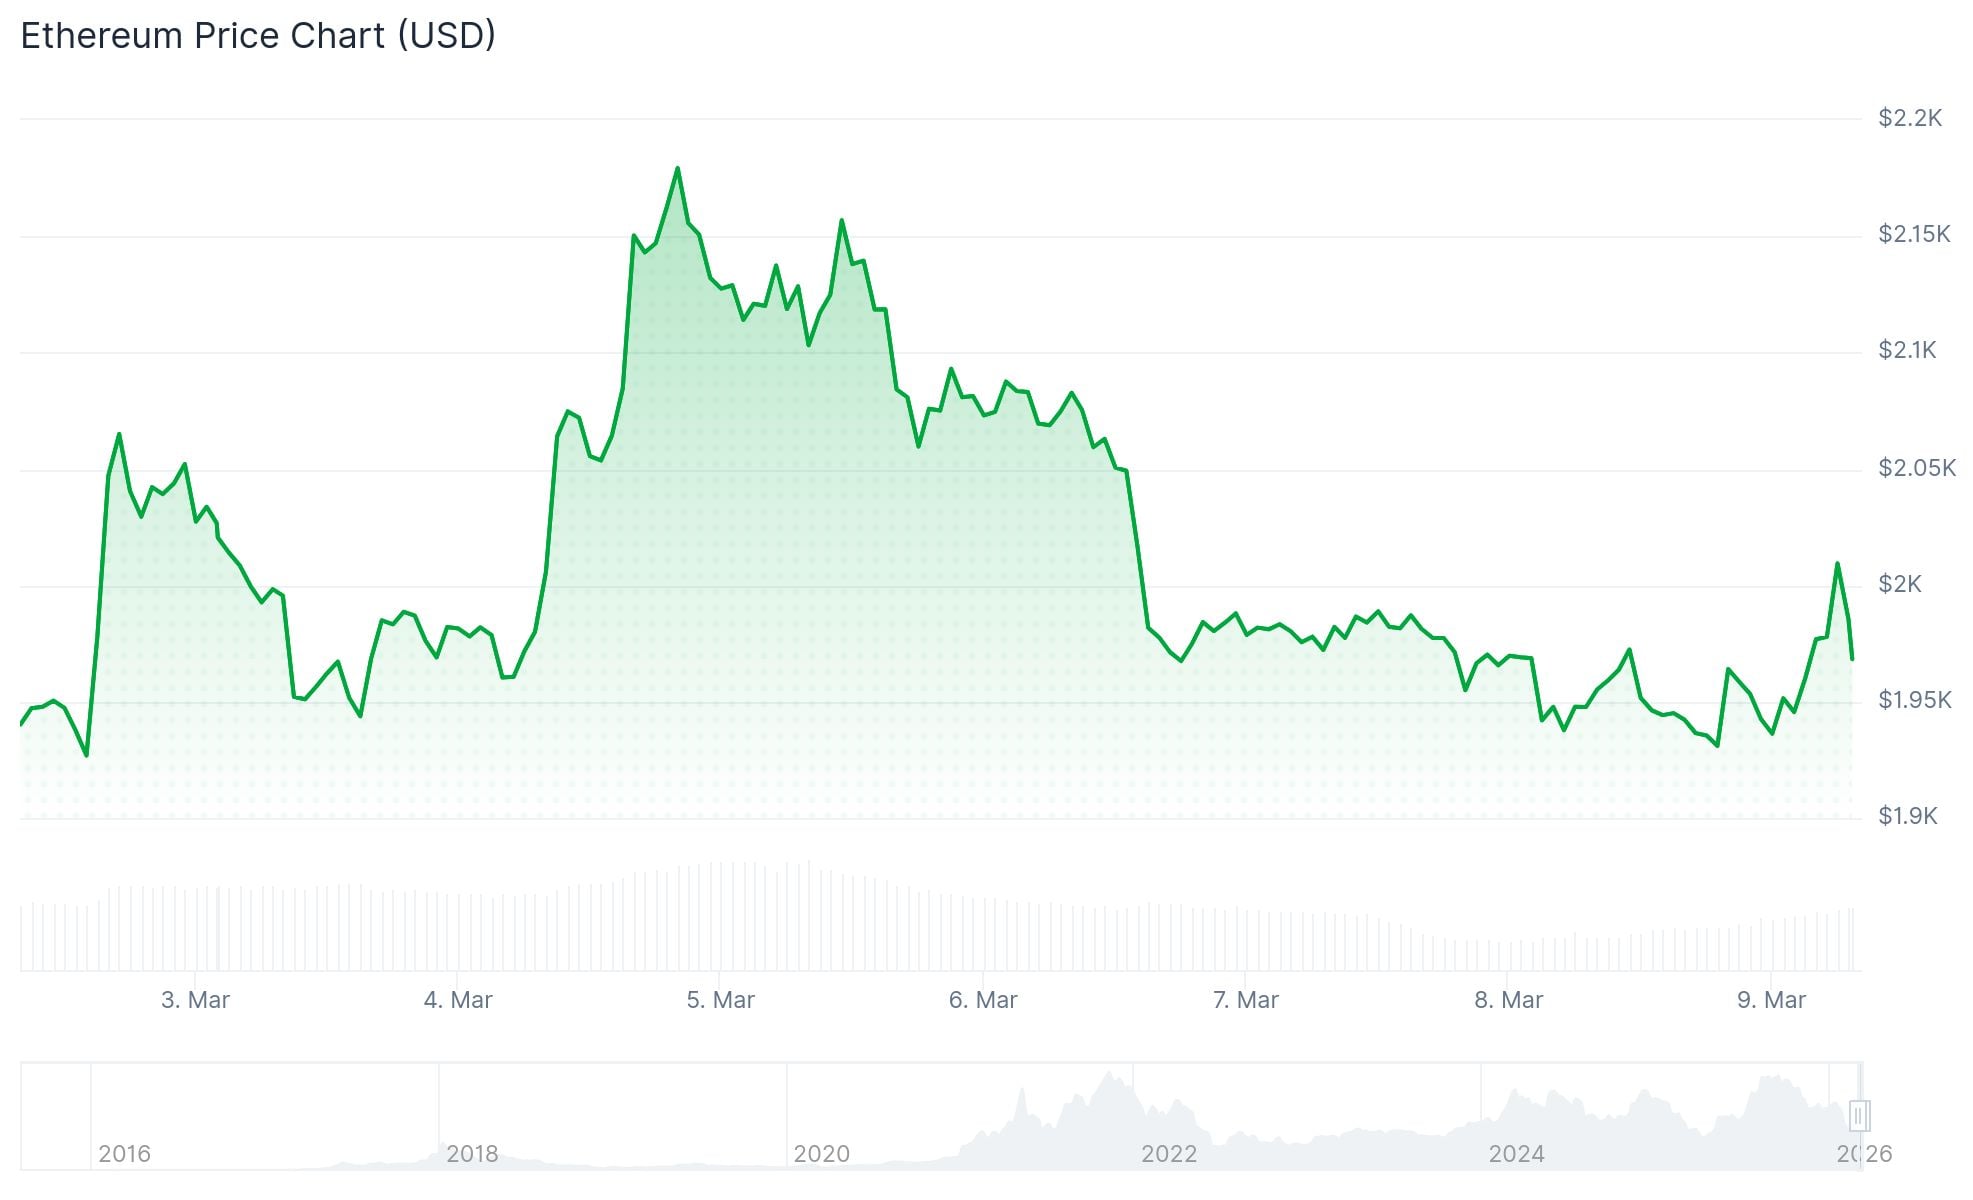
Since March 6, Ethereum has experienced significant selling pressure, declining almost 8% and now testing crucial support near the $1,900 mark. Market sentiment turned negative after Ethereum co-founder Jeffrey Wilcke moved 79,176 ETH—valued at approximately $157 million—to Kraken exchange.
Within cryptocurrency trading circles, substantial transfers to centralized exchanges typically signal potential selling activity. This transaction sparked concern among market participants and intensified the existing bearish momentum.
The cryptocurrency touched a bottom of $1,912 before finding temporary stability. Currently, as of March 9, ETH is changing hands below $1,980 and remains underneath the 100-hour Simple Moving Average, indicating continued near-term bearish pressure.
Large Holders Provide Demand Cushion
Between March 2 and March 6, Bitcoin spot exchange-traded funds saw aggregate net inflows totaling $568 million. Ethereum spot ETFs accumulated $23.56 million during the identical timeframe, demonstrating persistent institutional appetite despite ETH’s recent price deterioration.
Interestingly, while Wilcke’s transfer generated negative sentiment, analysis of wallet cohorts reveals a different story. Addresses containing between 100,000 and 10 million ETH have actively increased their holdings throughout this downturn.
This purchasing activity from substantial investors has provided a floor, preventing a more severe price capitulation. The market currently reflects a standoff between distribution pressure from the co-founder’s exchange deposit and strategic accumulation by other major stakeholders.
The $1,920 price point has served as immediate support thus far. Should demand continue defending this level, ETH could stage a bounce toward $1,980, with $2,000 representing the next psychological barrier.
Above current levels, resistance appears formidable and concentrated. The initial obstacle sits at $2,020, with $2,050 representing the subsequent challenge—aligning with the 50% Fibonacci retracement from the recent downward swing between $2,200 and $1,912.
Chart Indicators Signal Bearish Momentum
Technical readings continue reflecting bearish conditions. Virtually all significant moving averages remain positioned above current price action. The 200-period EMA stands at $2,899 while the 200-period SMA rests at $3,324, both considerably distant from current levels.
Near-term momentum indicators present a more balanced picture. The Relative Strength Index registers 42.4, the Stochastic oscillator shows 40.4, and the Commodity Channel Index displays −47.7. The Average Directional Index measures 29.9, indicating trend presence without reaching extreme territory.
Should the $1,920 level fail to hold, attention shifts to approximately $1,880 as the subsequent support zone. A breakdown through that area would likely target the $1,800 region—a price level where demand has historically emerged.
As of March 9, 2026, Ethereum was exchanging hands near $1,939, continuing to struggle below the psychologically significant $2,000 threshold it has been unable to decisively reclaim.