
 Consolidates Near $85 as Whale Activity and ETF Inflows Signal Potential Rally")
Key Takeaways
- SOL remains confined to a $78–$90 trading corridor for almost four weeks, displaying classic accumulation characteristics.
- On-chain transaction volumes surged 19.1% week-over-week, while trading volumes expanded from $22B to $34B.
- Institutional demand strengthens as spot SOL ETFs attracted $18.44 million over two consecutive days, following $44.44 million the prior week.
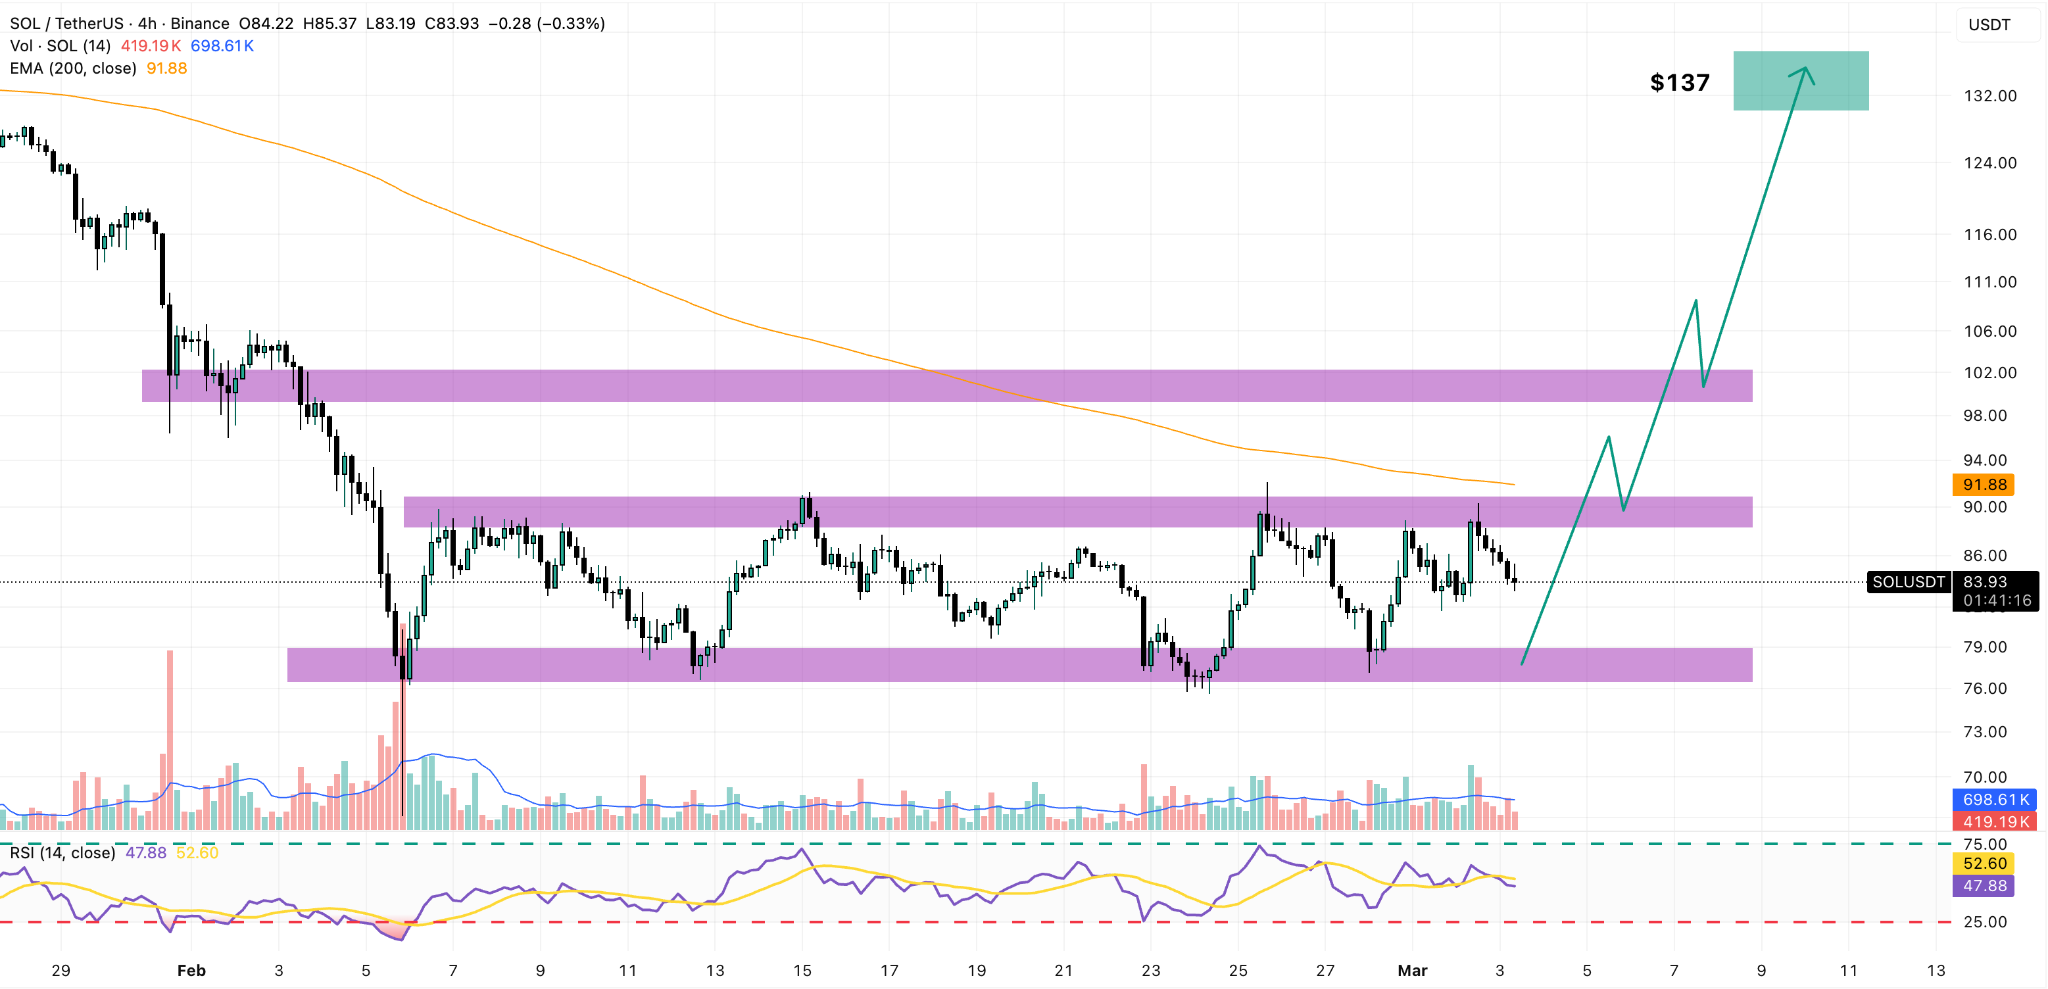
- Breaking decisively above the $90–$92 zone could propel SOL toward $100, with extended targets reaching $137 at the 200-day EMA.
- Loss of the $78 support floor risks a pullback toward $67.
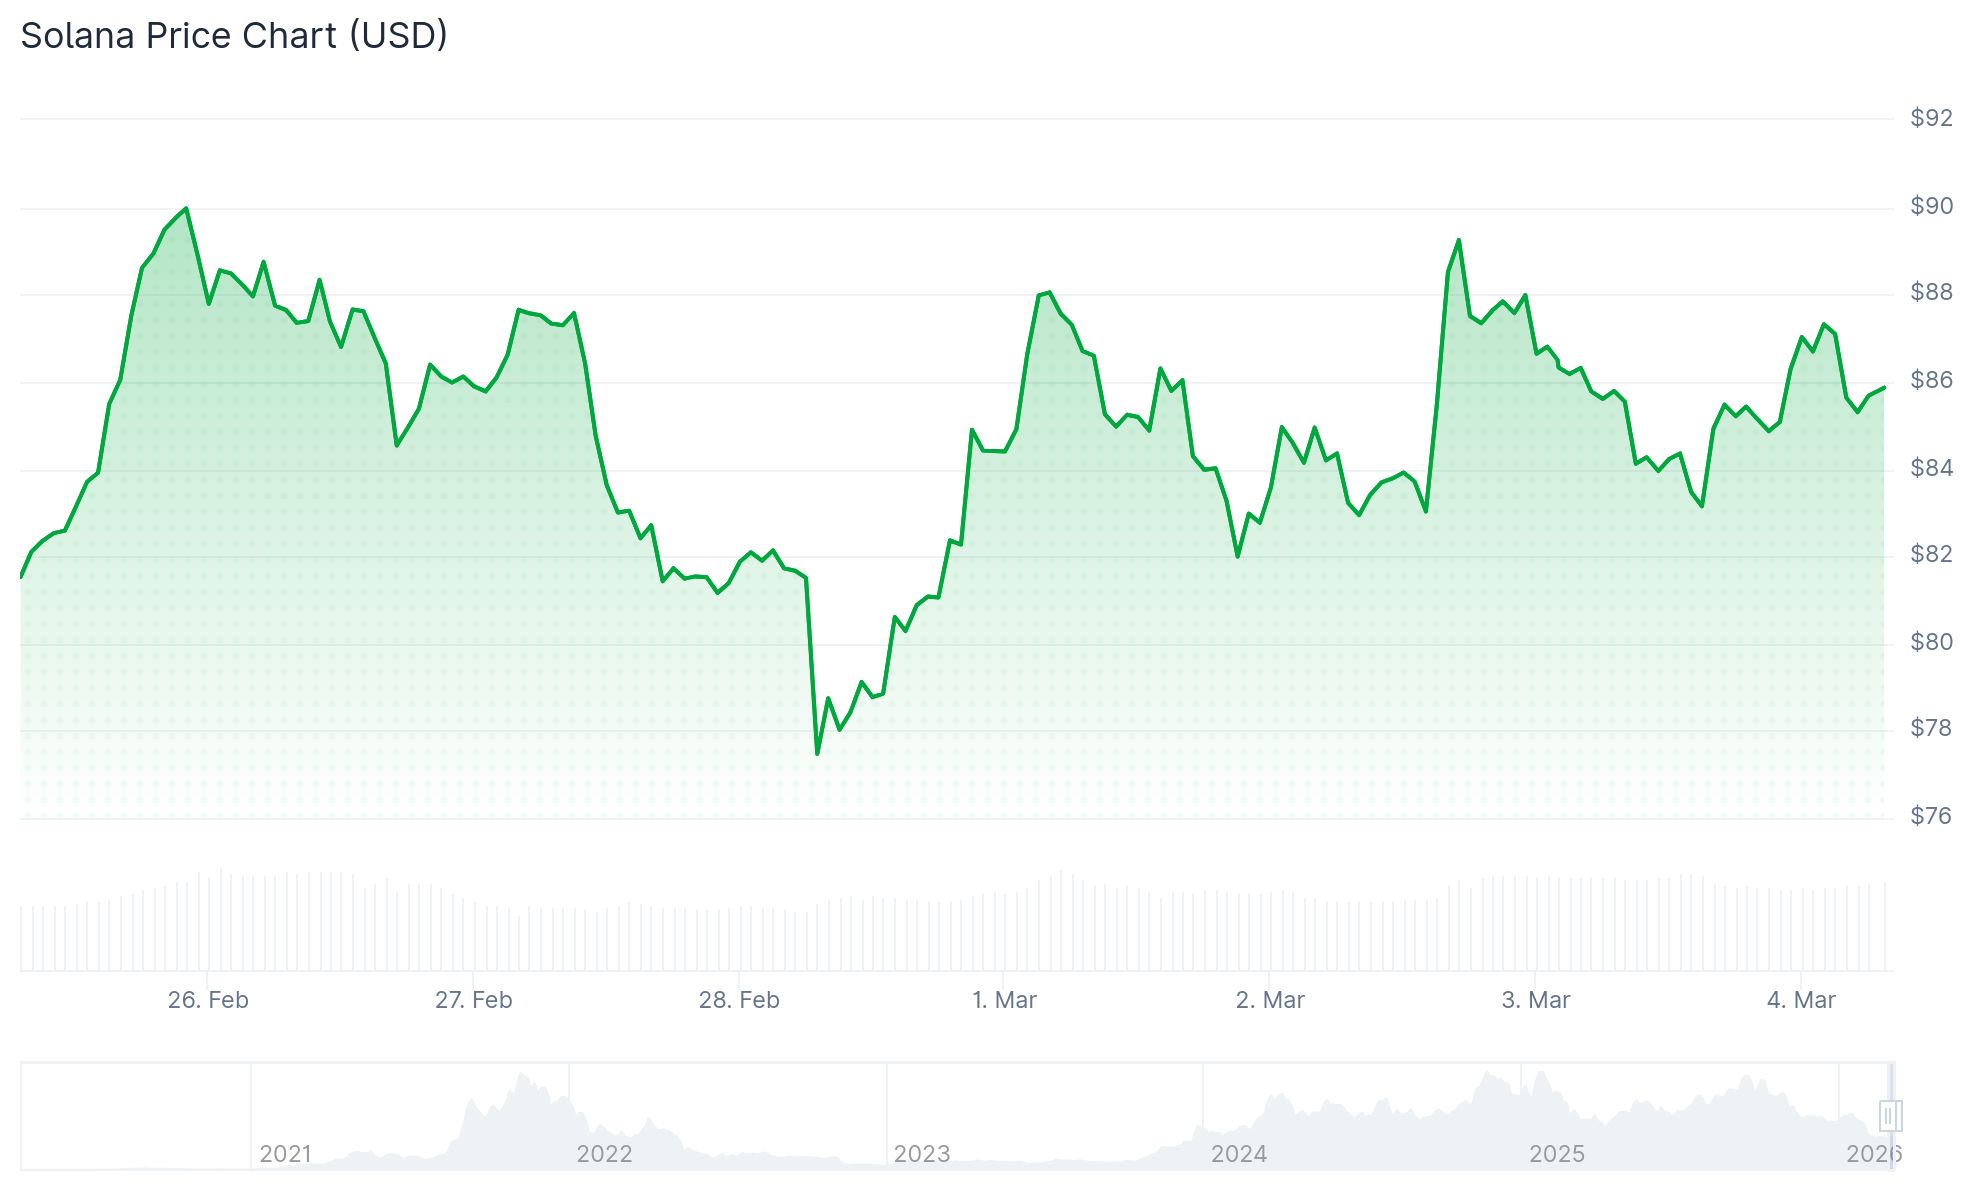
For nearly four weeks, Solana has remained trapped in a narrow price band spanning $78 to $90. This sideways action reflects an equilibrium between buying and selling pressure, forming what technical analysts recognize as a consolidation zone.
Large holders have demonstrated consistent behavior throughout this period—accumulating positions near the $78 low and distributing near the $90 ceiling. This cyclical pattern has emerged repeatedly since mid-February.
On February 12, SOL defended the $78 threshold and rallied back to $90 in just three trading sessions. A nearly identical sequence unfolded on February 24.
Currently, SOL changes hands around $85, having recently approached $88 before experiencing mild profit-taking.
The asset now trades beneath the upper boundary of its parallel channel formation at $87.96, which currently functions as immediate resistance.
Network Metrics Show Strengthening Fundamentals
Blockchain analytics from Artemis reveal that weekly transaction counts expanded from 764 million to 910 million—marking a substantial 19.1% weekly gain.
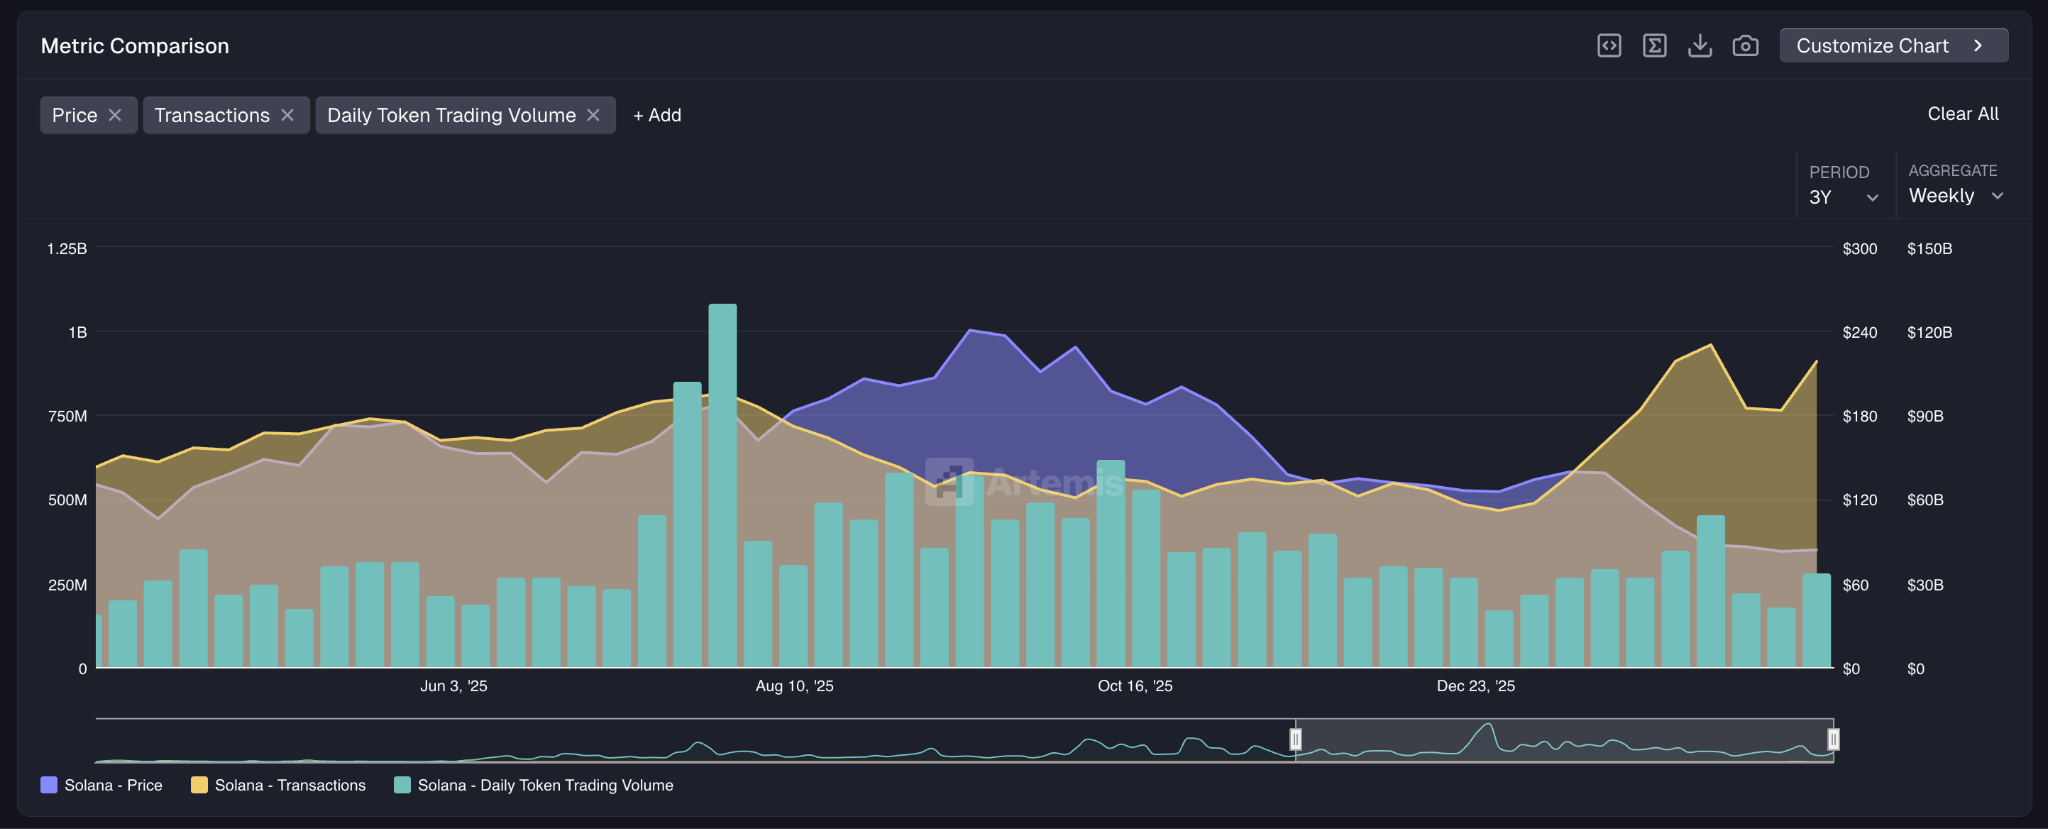
Concurrently, weekly active addresses increased, approaching a 2026 high for this particular indicator.
SOL’s trading volume expanded dramatically from $22 billion to $34 billion within seven days, indicating heightened market participation as the price repeatedly validates support at $78.
Institutional Capital Flows Through ETF Channels
Spot Solana ETFs registered $1.03 million in net inflows on Tuesday, building on the previous day’s $17.41 million—combining for $18.44 million across two sessions.
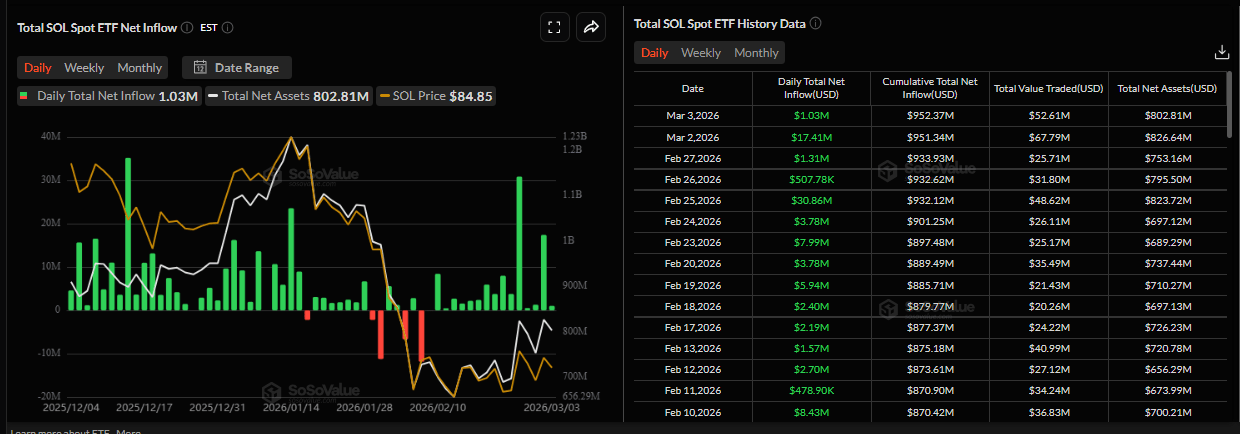
The preceding week delivered $44.44 million in cumulative ETF inflows, marking the strongest weekly performance since mid-January.
Derivatives funding rates reversed to positive territory on Wednesday at 0.0008%, indicating growing bullish positioning among leveraged traders.
The daily Relative Strength Index has climbed back toward the mid-40s after touching oversold conditions, while the MACD indicator maintains positive momentum.
Immediate overhead resistance appears at the 23.6% Fibonacci retracement level of $86.60, with the next significant barrier at $98.42 (38.2% Fib level) coinciding with the 50-day EMA.
A decisive daily close above $92 would likely activate the $106 zone, and continued strength could extend the move toward $120.
The 200-period exponential moving average on the daily timeframe currently resides at $137—representing a potential 63% gain from present levels should Solana establish a sustained uptrend.
Downside protection currently exists at $77.60, with secondary support identified at the previous swing low of $67.50.
Market analysts view $80 as a pivotal level—sustained weakness below this threshold would likely accelerate declines toward $75 or $70.
Recent hourly timeframe buy signals, both originating near $78, successfully reached the $90 objective, delivering returns of 4.4x and 2.3x on leveraged positions.
SOL has appreciated 9.3% during the past week, outperforming all other top-five cryptocurrencies by market capitalization over this timeframe.