
 Shows Early Recovery Signs as Price Defends $85 Support Zone")
TLDR
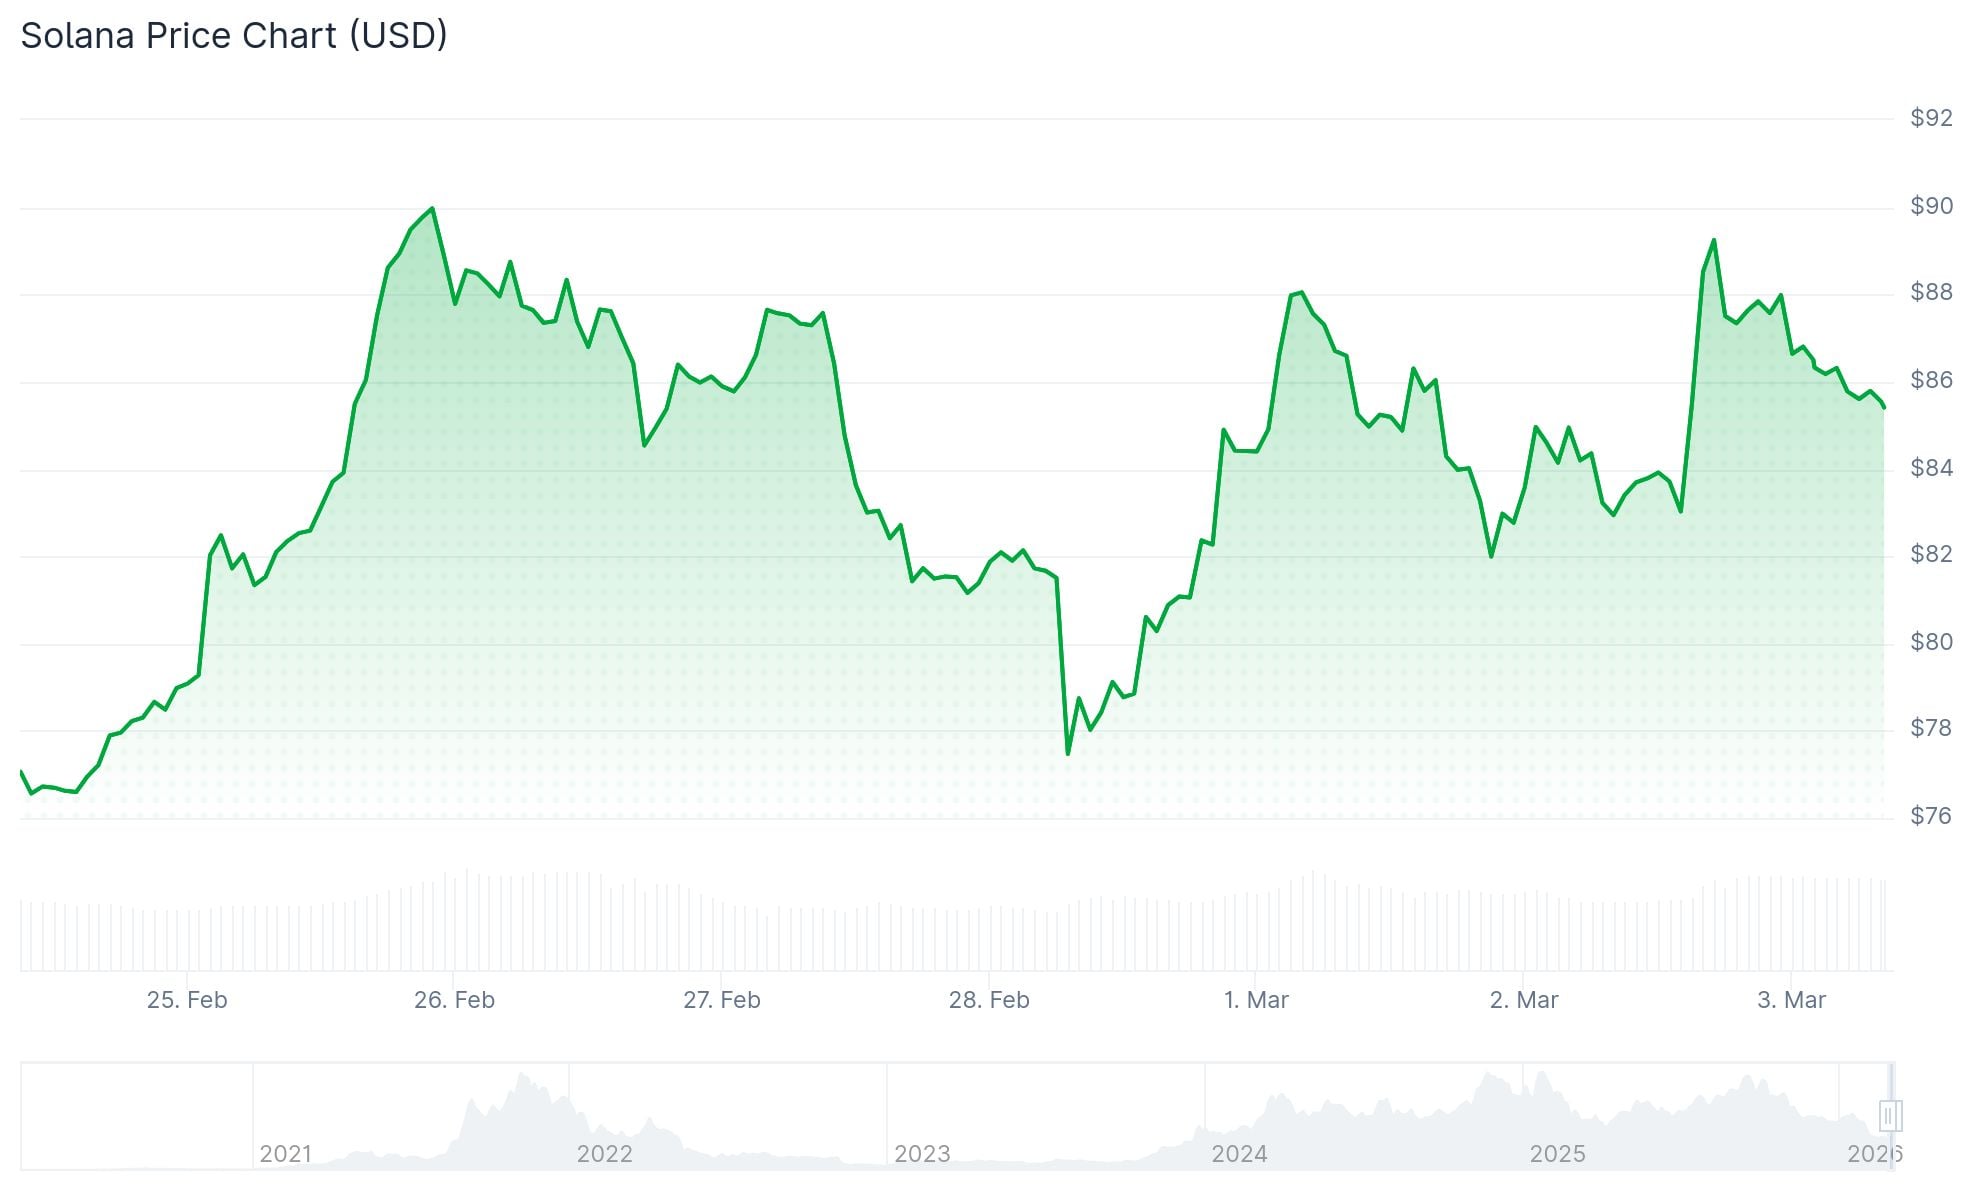
- SOL fell below $88 following rejection at $90 but discovered solid support near $85
- RSI currently at 47.68 — showing neutral momentum without clear directional bias
- SOL broke back above the Ichimoku cloud on 4-hour timeframe, marking the first occurrence since January
- Market observers identify $88.60 as critical resistance; clearing this level may trigger moves toward $95–$100
- A bullish moving average crossover emerged with 50MA climbing above 100MA, indicating momentum rotation
Solana (SOL) is currently fluctuating near the $87–$88 price zone following a retreat from its recent peak at $90.29. The token experienced downward pressure below both $88 and $87 thresholds before establishing stability above the $85 support area.
SOL maintains its position above the 100-hourly simple moving average at present. Trading volume over the last 24 hours reached $9.99 billion, while the market capitalization stands at $49.91 billion. The asset has gained 4.70% during the same timeframe.
The recent correction pushed the price beneath the 50% Fibonacci retracement level calculated from the swing low of $81.71 to the swing high of $90.29. An ascending trend line has developed on the hourly timeframe, providing support around $85, which coincides with the 61.8% Fibonacci level.
Crypto analyst BitGuru observed on March 2 that SOL appears to have completed its correction phase and transitioned into a consolidation pattern. His analysis highlights the formation of higher lows near a well-defined support zone, suggesting diminishing downside pressure.
Traders are monitoring $88.60 as the initial critical threshold for SOL to recapture. According to market analyst More Crypto Online, a successful push above Sunday’s high at $88.60 would indicate that buying pressure is returning.
Key Resistance Levels to Watch
Immediate resistance zones are positioned at $88, followed by $90, and then $92. Breaking decisively above $92 could clear the path for advances toward $96 and ultimately $100.
Should SOL struggle to overcome the $90 barrier, support levels to monitor on the downside include $84 and $82. A breakdown below $82 could potentially drive the price toward $76.50.
The Relative Strength Index reads 47.68 — positioned in neutral territory. The MACD indicator shows 1.80, marginally positive, though it remains beneath the signal line at -4.29. Selling pressure is subsiding, yet buyers haven’t established clear dominance.
Solana continues trading significantly below its extended-term moving averages. The 50-day SMA sits at $103.66, the 100-day at $117.73, and the 200-day at $156.34.
Ichimoku Cloud Break Signals Shift
On the 4-hour timeframe, SOL successfully penetrated above the Ichimoku cloud barrier for the first time since the beginning of January. During the entire month of February, all upward attempts were rejected at this cloud structure.
The 50-period moving average has also completed a bullish crossover above the 100-period moving average on the same 4-hour chart. Technical analyst CryptoCurb characterized this development as a meaningful shift in underlying trend dynamics.
Both moving averages are now exhibiting upward trajectories. A technical projection published by CryptoCurb indicates the possibility of price appreciation toward $100 and higher targets, provided the token sustains above the recently reclaimed technical levels.
Currently, SOL is changing hands at $87.64 with preliminary recovery indicators visible, though a confirmed trend reversal has not yet materialized.