
 Sees $220M in Short Liquidations as Volatility Reaches Multi-Month Peak")
TLDR
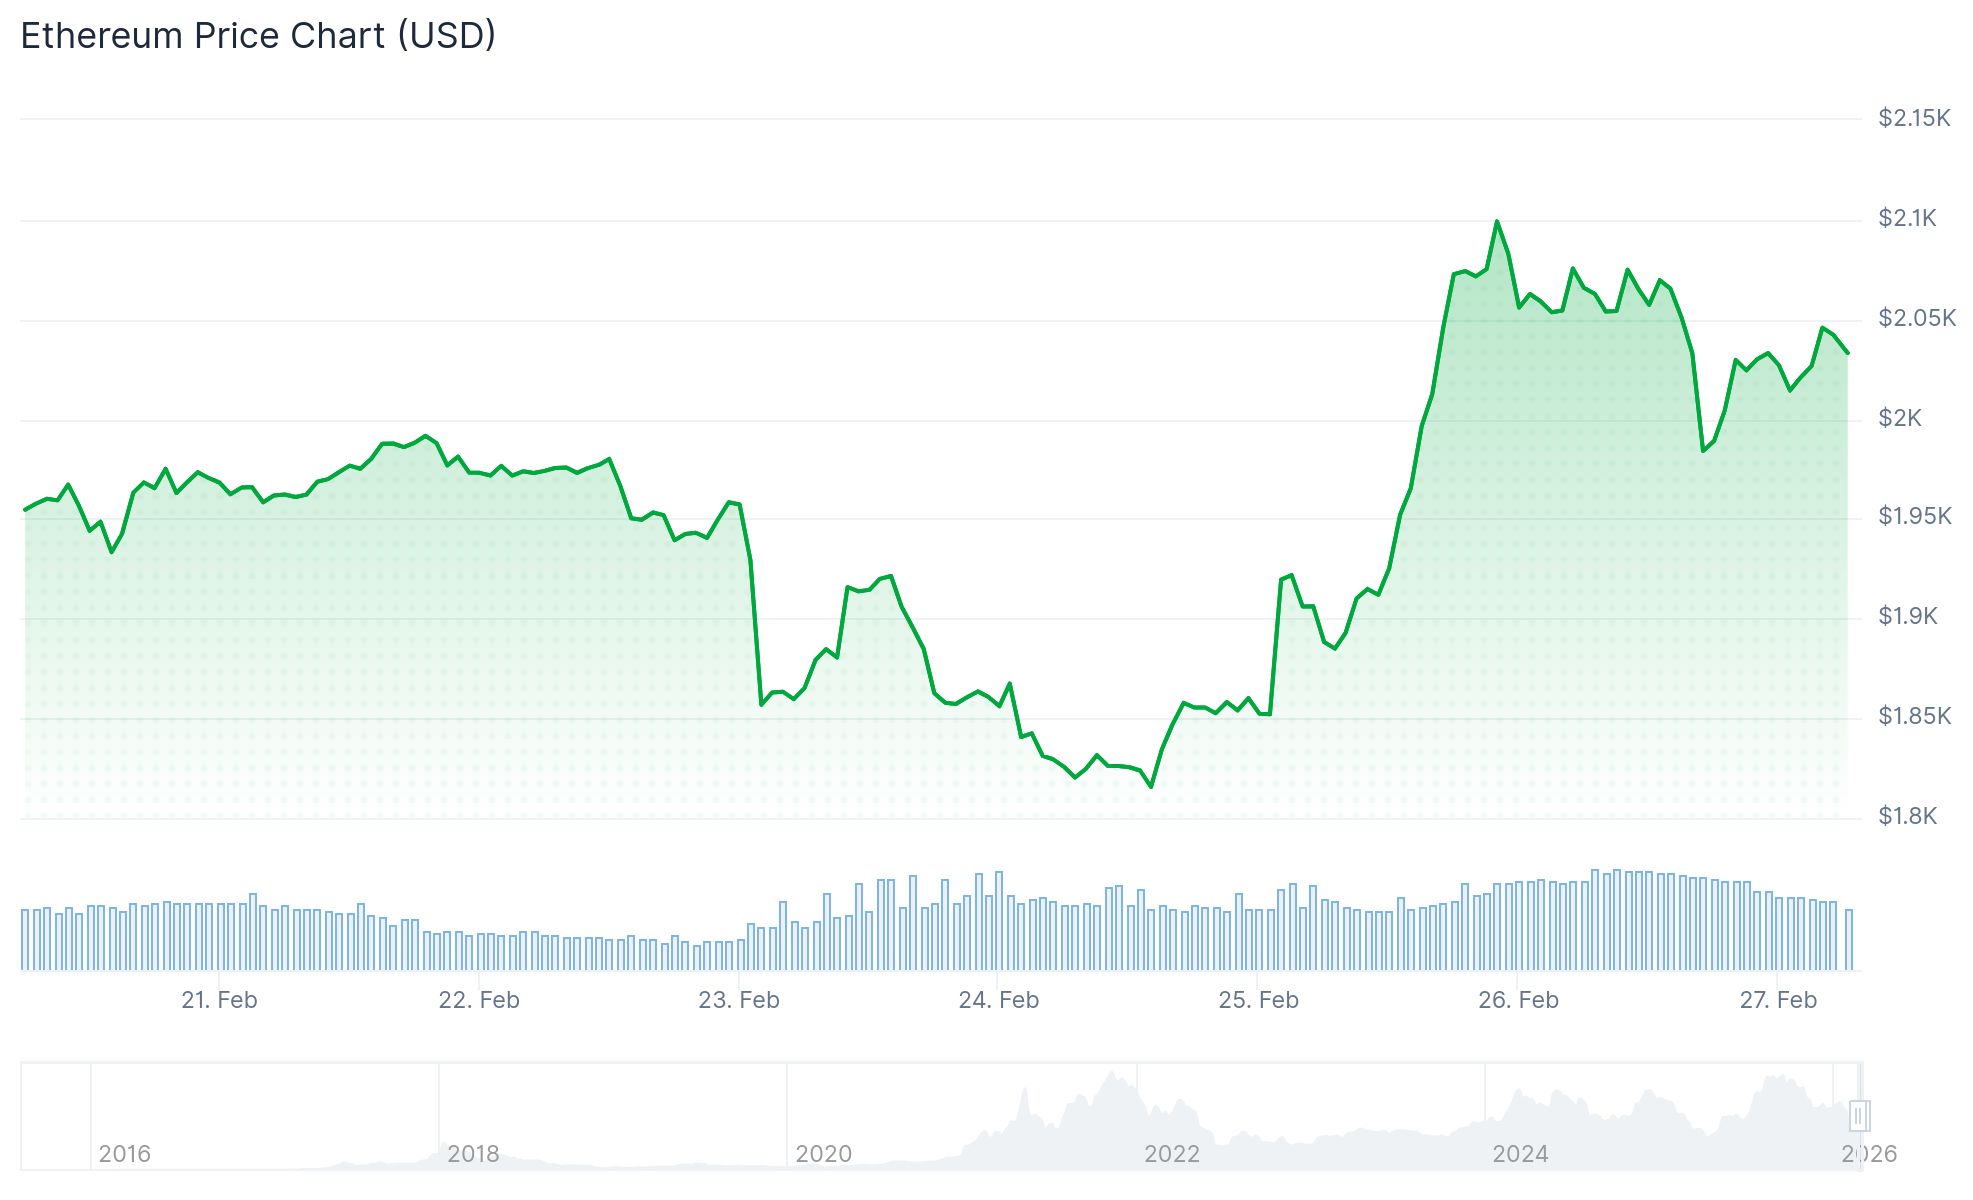
- ETH climbed to $2,150 this week before facing rejection at multiple technical resistance levels
- The $2,100 price point serves as a pivotal level, aligning with the realized price for whale wallets holding 100,000+ ETH
- Ethereum’s 30-day realized volatility climbs to 0.97, the highest reading observed since March 2025
- Over $220M in short positions were liquidated within a 48-hour window, as funding rates flipped to positive
- Institutional ETF outflows appear to be slowing, though clear accumulation patterns have not yet emerged
Ethereum’s price rallied to $2,150 during Thursday’s session before pulling back. The second-largest cryptocurrency by market cap remains confined within a tight range, with $2,000 functioning as key support while $2,100 presents itself as the next major resistance.
A daily close above $2,100 holds special importance because this level matches the realized price for wallet addresses containing 100,000 ETH or more. This realized price metric calculates the average purchase price based on the most recent on-chain transaction, offering valuable perspective on whether large holders remain in profit.
Looking at historical patterns since 2020, ETH has seldom traded below the cost basis of this whale segment, with 2022’s prolonged bear market standing as the primary exception. Past encounters with this level have frequently led to price rallies.
Futures and Funding Rates
The futures market experienced over $220 million in short position liquidations across the last 48 hours, wiping out significant leveraged bets. Binance funding rates, which dropped sharply negative in early May as bearish sentiment intensified, have now flipped to positive 0.23%.
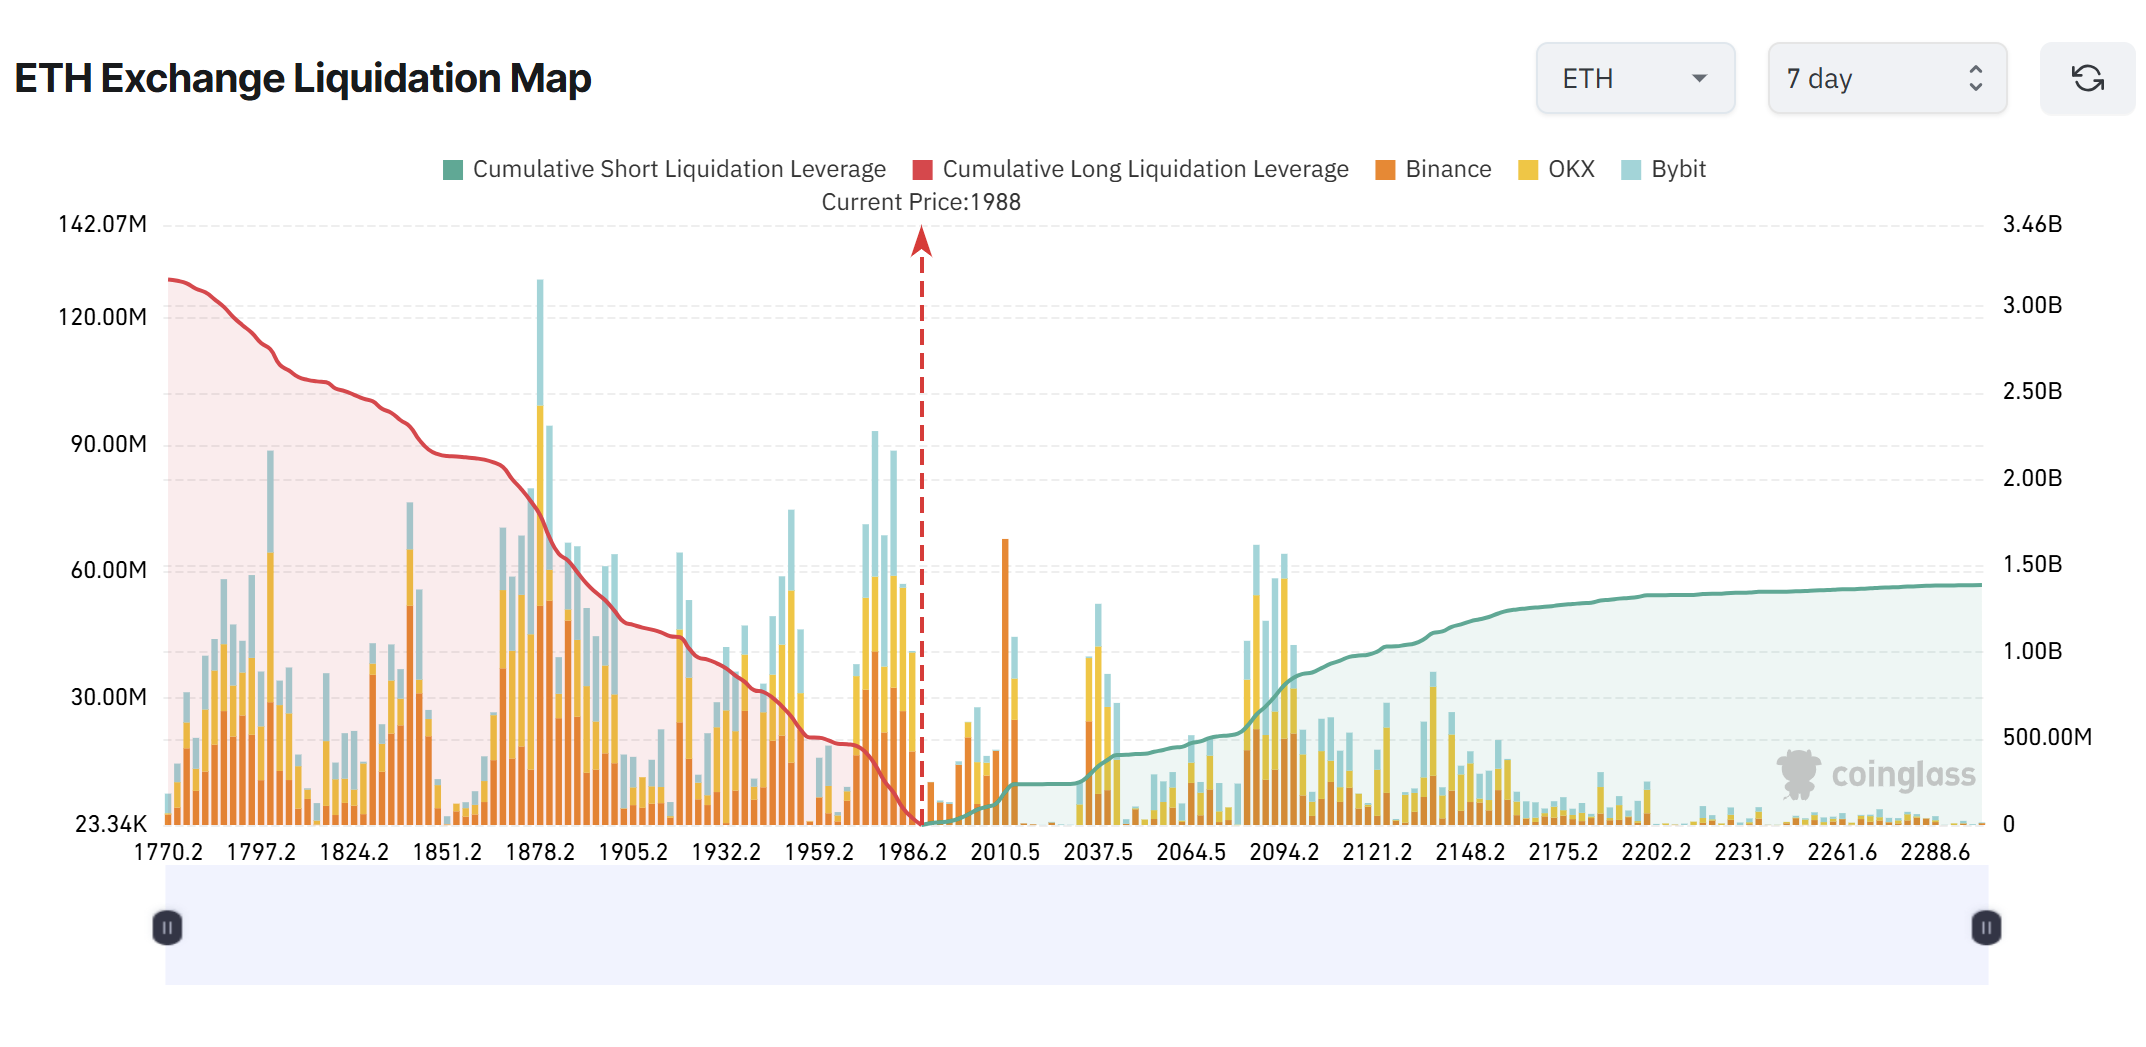
This shift demonstrates that traders who initiated short positions during the late stages of the downturn were forced out of their trades. However, with funding rates now elevated in positive territory, long positions dominate the market structure, potentially setting up conditions for a long squeeze toward $1,800 if bullish momentum fades.
Roughly $2.66 billion in long liquidation exposure sits clustered near the $1,800 level, forming a significant liquidity zone below current prices.
Volatility and ETF Flows
Ethereum’s 30-day realized volatility on Binance has surged to roughly 0.97, marking the highest level seen since March 2025. Elevated volatility during this period may reflect market uncertainty and lack of directional conviction rather than signaling a definitive trend.
Price remains trading below the 50-day, 100-day, and 200-day moving averages. Since the rejection near $4,800 in late 2025, each rally attempt has formed progressively lower highs, pointing to ongoing distribution.
On the ETF front, selling pressure shows signs of easing. After experiencing heavy outflows through mid-2025, recent data reveals reduced activity in both directions. Institutional selling appears to be moderating, though definitive accumulation trends remain elusive.
Analyst Leon Waidmann noted that retail traders with weak conviction have largely exited their holdings. Short interest keeps declining, while heavily leveraged long positions have been hesitant to build significant exposure.
Technical analyst IncomeSharks pointed out three resistance zones above, including several SuperTrend rejections and channel resistance situated around $2,250. The analyst also emphasized April’s lows near $1,500 as an important support level if buying pressure fails to sustain.
At the time of writing, ETH was trading at $2,034.