
 Price Analysis: Major Holders Continue Accumulating Despite Weekly RSI Hitting Oversold Territory")
Key Takeaways
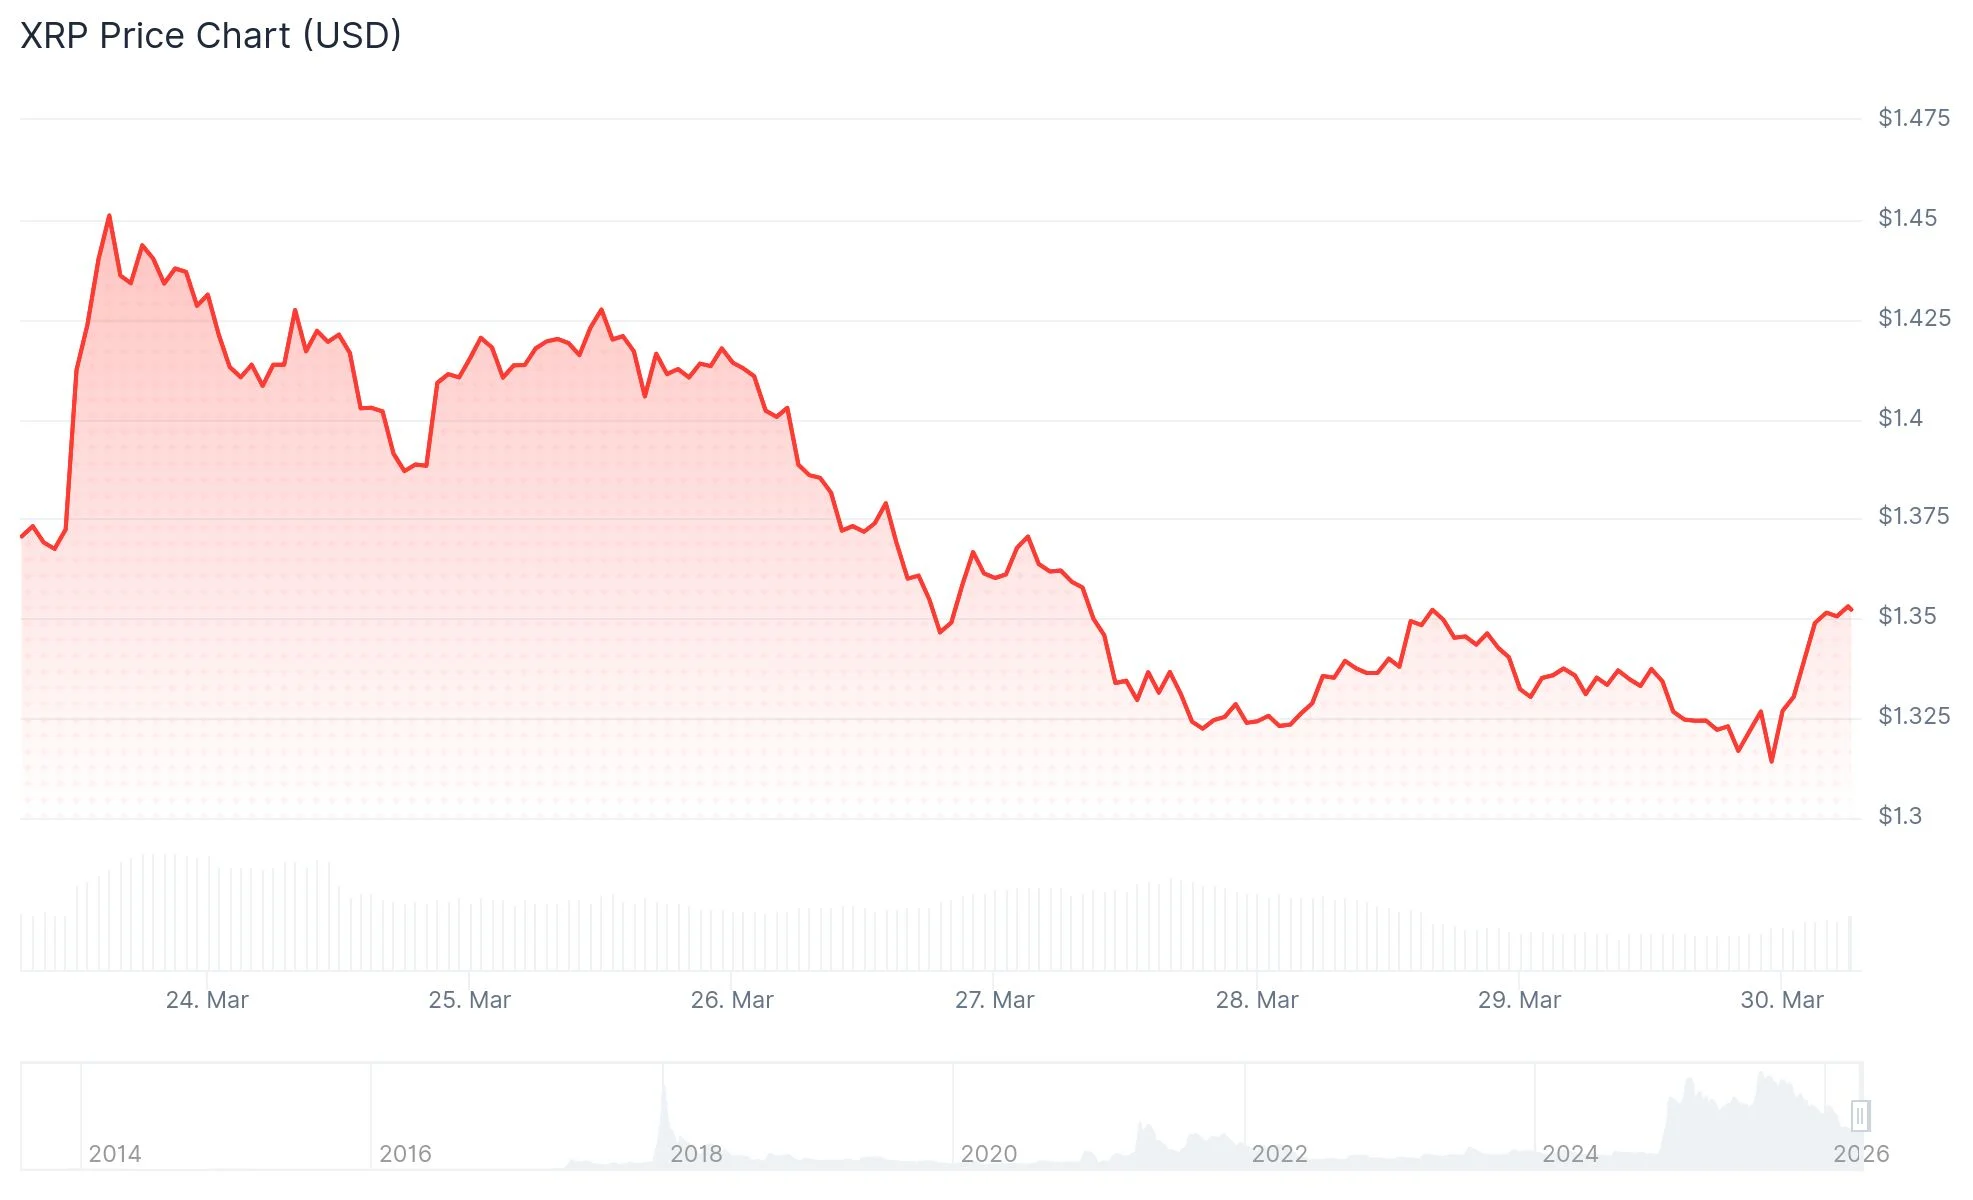
- XRP maintains its position around $1.32, defending a crucial support area spanning $1.30 to $1.32.
- Weekly RSI has declined to 32, a threshold historically associated with previous cycle bottoms for XRP.
- Technical analysis reveals a bearish pattern on daily timeframes with declining peaks following the $2.416 surge.
- XRP Ledger transaction volume has dipped under the 1 million daily mark after experiencing a recent surge.
- Should $1.30 fail to hold, XRP faces potential downside targets at $1.24, $1.20, or the February bottom of $1.118.
XRP finds itself at a pivotal moment in late March 2026, currently exchanging hands around $1.32. The digital asset maintains a tight support corridor, though technical momentum signals continue displaying weakness throughout multiple timeframes.
The weekly Relative Strength Index (RSI) has declined to approximately 32. This threshold typically signals oversold conditions on extended timeframes. Historical XRP market cycles show comparable RSI values emerging during the final phases of prolonged corrections. Nevertheless, RSI readings by themselves don’t guarantee price reversals. Assets frequently remain depressed while momentum indicators stay subdued for extended periods.
Daily chart analysis reveals a more defined narrative regarding present directional bias. Following XRP’s advance to $2.416, the cryptocurrency started establishing declining peaks. This formation indicates sellers maintain dominance over buying pressure currently. Since reaching that zenith, XRP has retraced and consolidated within a confined price corridor.
Critical Price Zones to Monitor
The present support boundary ranges from $1.30 to $1.32. XRP currently trades directly within this critical band. A confirmed daily settlement beneath $1.30 would expose pathways to deeper targets, specifically $1.24 and $1.20. The February 2026 bottom near $1.118 stands as the most significant downside benchmark.
Regarding upside obstacles, initial resistance emerges around $1.42 and $1.43. This zone aligns with the 23.6% Fibonacci retracement level at $1.4247. Beyond that barrier, market participants are monitoring $1.50, $1.614, and $1.767. XRP requires a decisive close above $1.42 to alter its current momentum trajectory.
The MACD indicator remains positioned beneath the zero threshold on daily charts. This configuration suggests purchasing forces haven’t regained market control. The Chaikin Money Flow indicator registers approximately -0.17, indicating persistent net distribution pressure. Multiple short-duration recovery attempts have stalled near $1.45, demonstrating sellers remain active during upward movements.
Market analyst CW shared observations on X highlighting XRP whale activity spanning more than twelve months. The research identifies the whale accumulation corridor between $1.20 and $3.00, with significant purchasing also documented previously in the $0.30 to $1.30 bracket. The analyst’s assessment indicates these large holders haven’t distributed to smaller investors and maintain accumulation strategies.
Network Activity Drops Below Key Threshold
XRP Ledger transaction counts have recently fallen beneath 1 million daily payments, a metric frequently employed to assess blockchain vitality. This reduction follows a temporary elevation in network usage. Technical observers propose this contraction might represent normalization after heightened institutional or large-volume transfers, rather than indicating sustained deterioration.
With trading activity compressed and price action confined, certain analysts theorize XRP may be experiencing a liquidity-constrained environment. Under thin market conditions, relatively modest demand influxes can trigger amplified price reactions.
XRP presently trades around $1.32, with the $1.30 threshold serving as the final obvious support before exposing 2026’s lower price extremes.