
 Drops 15% This Month, Yet Pre-Rally Indicators Resurface With $1.23B ETF Inflows")
TLDR
- XRP (XRP) currently trades near $1.39, experiencing a 15.6% decline throughout February 2026, positioned beneath both 50-day and 200-day exponential moving averages.
- Three technical indicators that preceded the November 2024 price surge — increased exchange inflows, declining USD liquidity, and compressed XRP liquidity — have reappeared.
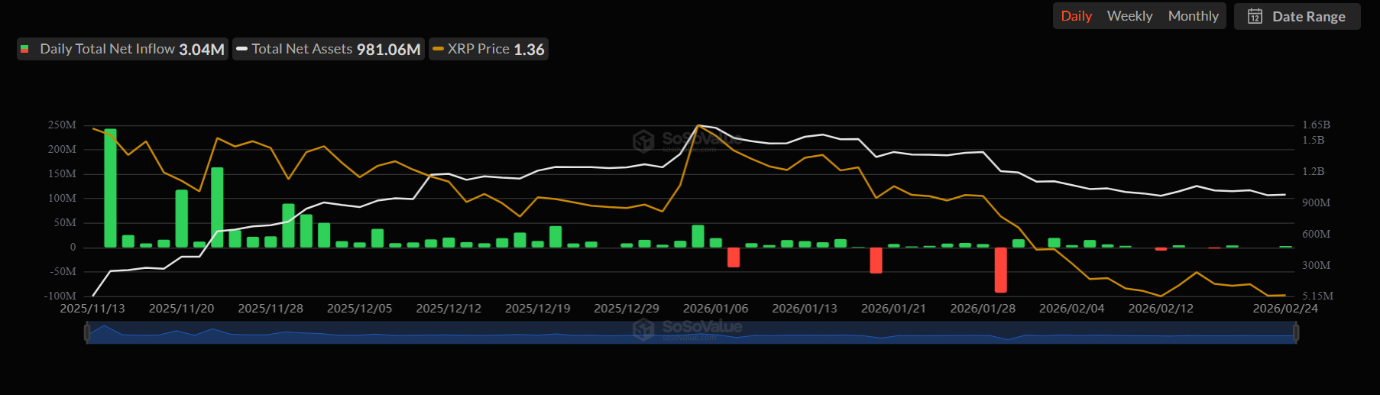
- Spot XRP ETFs accumulated $3.04M in net inflows on February 24, elevating total net inflows to $1.23B since inception.
- Probability of a Federal Reserve rate reduction in June declined to 49.6%, dampening cryptocurrency market sentiment following robust consumer confidence figures.
- Price projections from analysts span from $2.00 in the near term to $10 if historical breakout patterns from 2024 materialize again.
XRP (XRP) is currently changing hands around $1.39 in late February 2026, reflecting a 15.6% monthly decline. The digital asset remains positioned below both its 50-day and 200-day exponential moving averages, suggesting near-term bearish momentum.
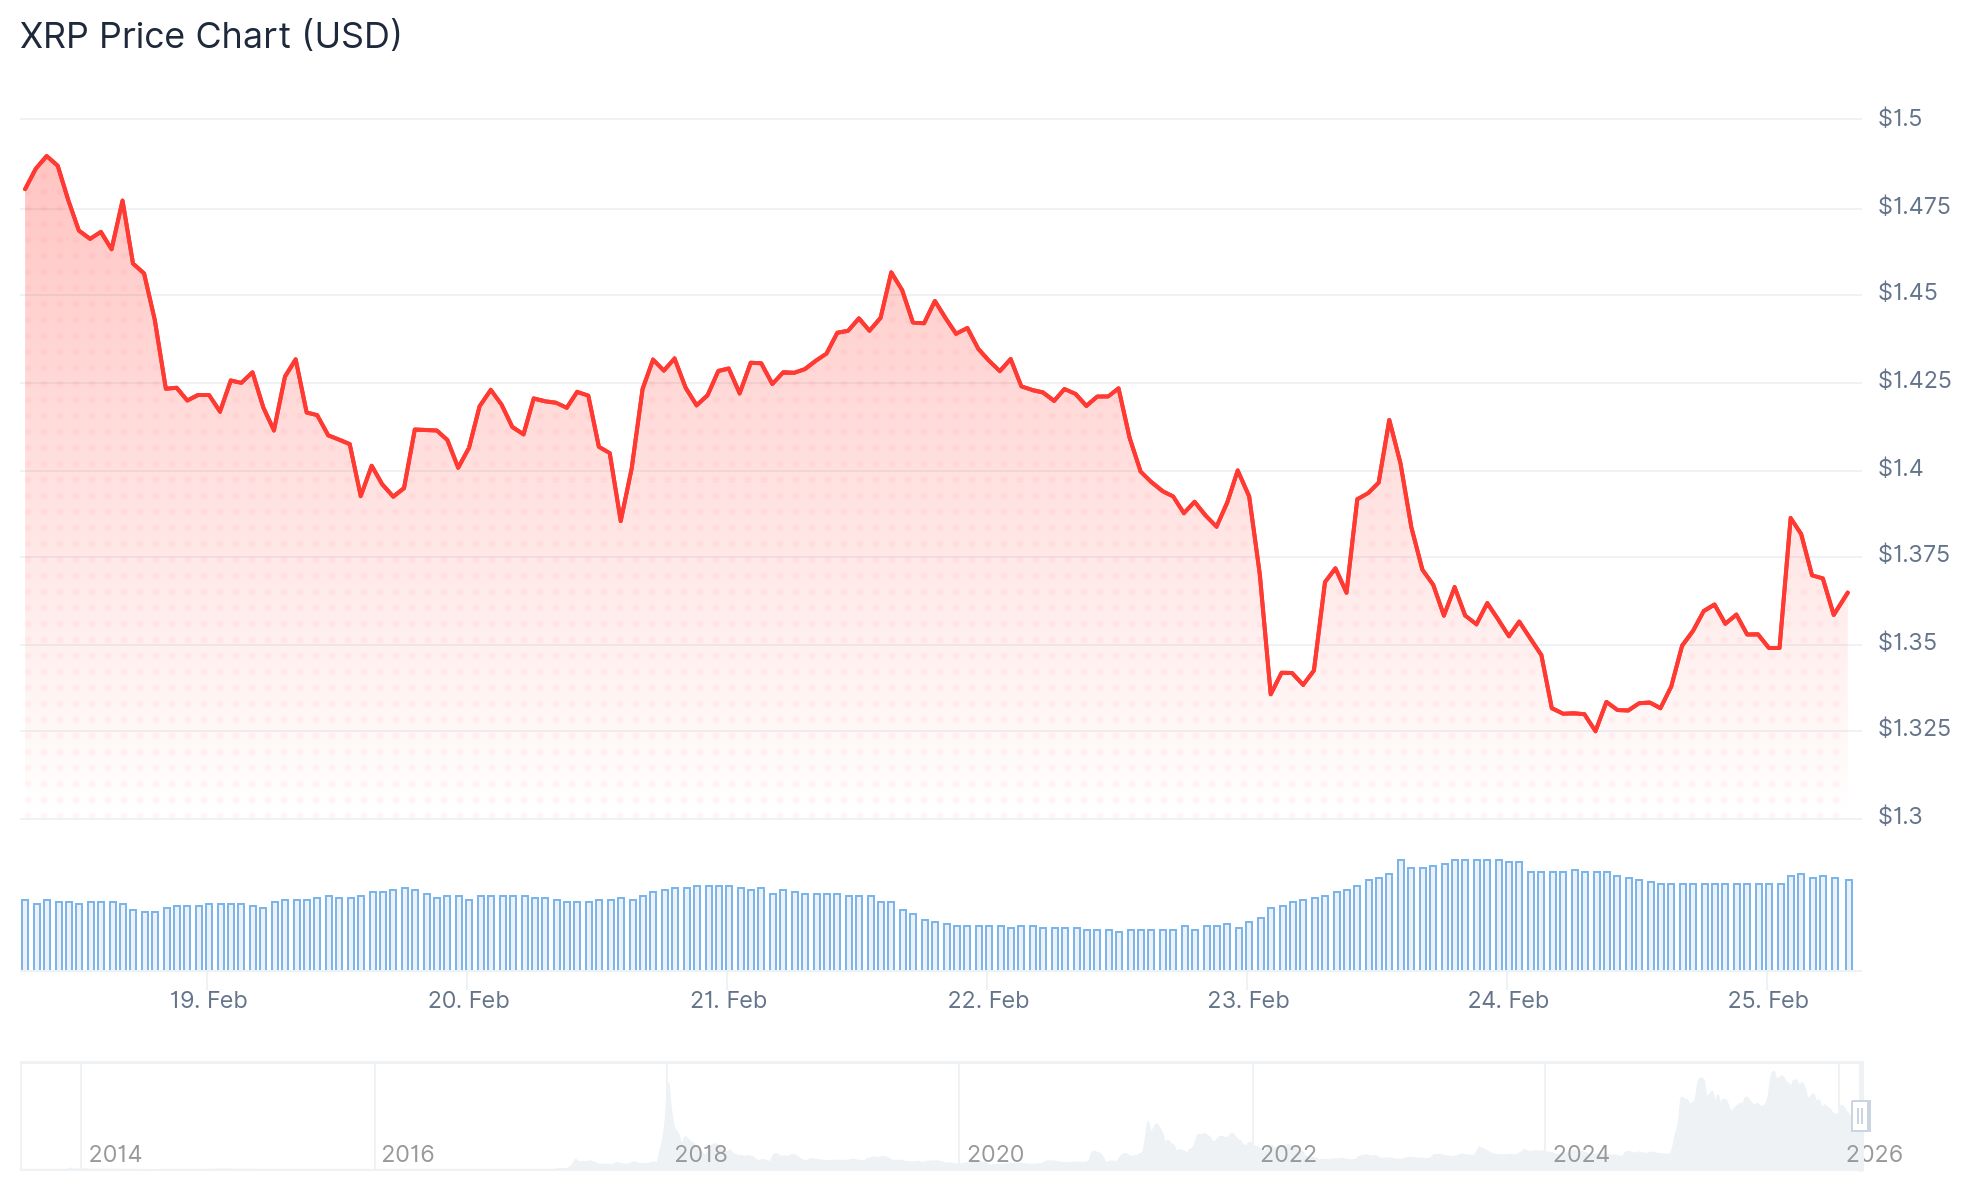
However, despite this downward pressure, market observers are monitoring three technical indicators that materialized just before XRP’s remarkable rally in late 2024.
During November 2024, XRP experienced a dramatic surge from $0.50 to reach $3.40 by January 2025, coinciding with Donald Trump’s victory in the U.S. presidential election. This movement represented one of the most aggressive price rallies in the token’s trading history.
CryptoQuant analyst Xaif indicates these identical three signals are reappearing in February 2026.
The initial indicator involves elevated exchange inflows on Binance. Prior to the 2024 rally, substantial XRP deposits to the exchange surged — notably 15.12 billion XRP on October 20, 2024, and 10.345 billion XRP on November 23, 2024. These inflows didn’t trigger price declines. Rather, market volatility intensified and prices accelerated upward. Comparable spikes are materializing currently.
Liquidity Compression Underway
The second indicator involves contracting USD liquidity within XRP’s automated market maker pools. Before the 2024 breakout, daily USD liquidity declined to approximately $1.5 million. During February 2026, this metric ranges between $1.9 million and $2.1 million — a similar contraction following a peak exceeding $6 million in September 2025.
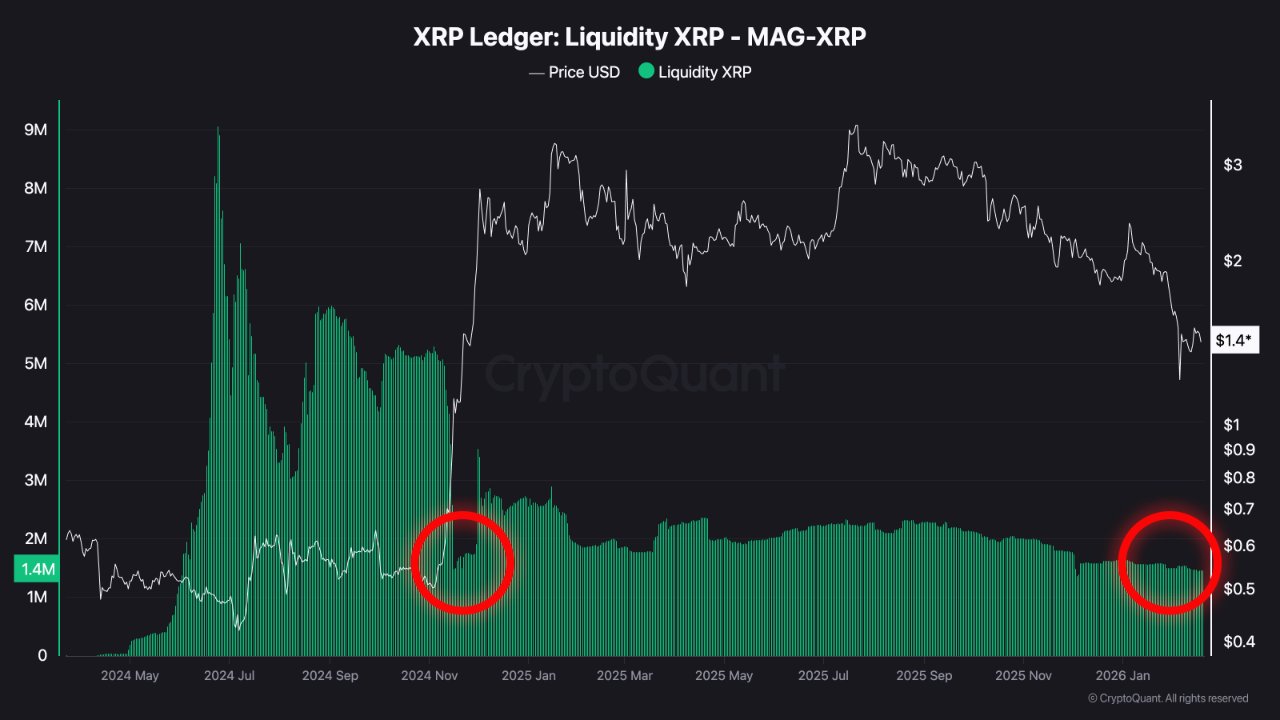
The third indicator is diminishing XRP liquidity. During November 2024, accessible XRP in AMM pools contracted to 1.5 million preceding the rally. Currently, daily XRP liquidity averages 1.385 million — registering even lower than pre-rally measurements.
Xaif suggests these three concurrent indicators could establish conditions for a movement toward $10, representing a 619% appreciation from present levels. He advises traders to validate with derivatives metrics and funding rates before taking positions.
Institutional Inflows Meet Macroeconomic Resistance
On the institutional investment front, XRP spot ETFs registered $3.04 million in net inflows on February 24, elevating cumulative inflows to $1.23 billion since the products launched in November. These exchange-traded funds have recorded only five days of net outflows during this period.
U.S. consumer confidence measured 91 in February, surpassing the anticipated 87, which diminished market expectations for a June Federal Reserve rate cut. The CME FedWatch Tool reflected these odds declining from 54.3% to 49.6% on February 24.
XRP settled at $1.3489 on February 24 before advancing 3.66% to $1.3983 on February 25 morning. Critical resistance levels are positioned at $1.50, $2.00, and $2.50, while support zones exist at $1.00 and $0.7773.