
 Targets $95 Breakout as Technical Indicators Point to Major Price Movement")
TLDR
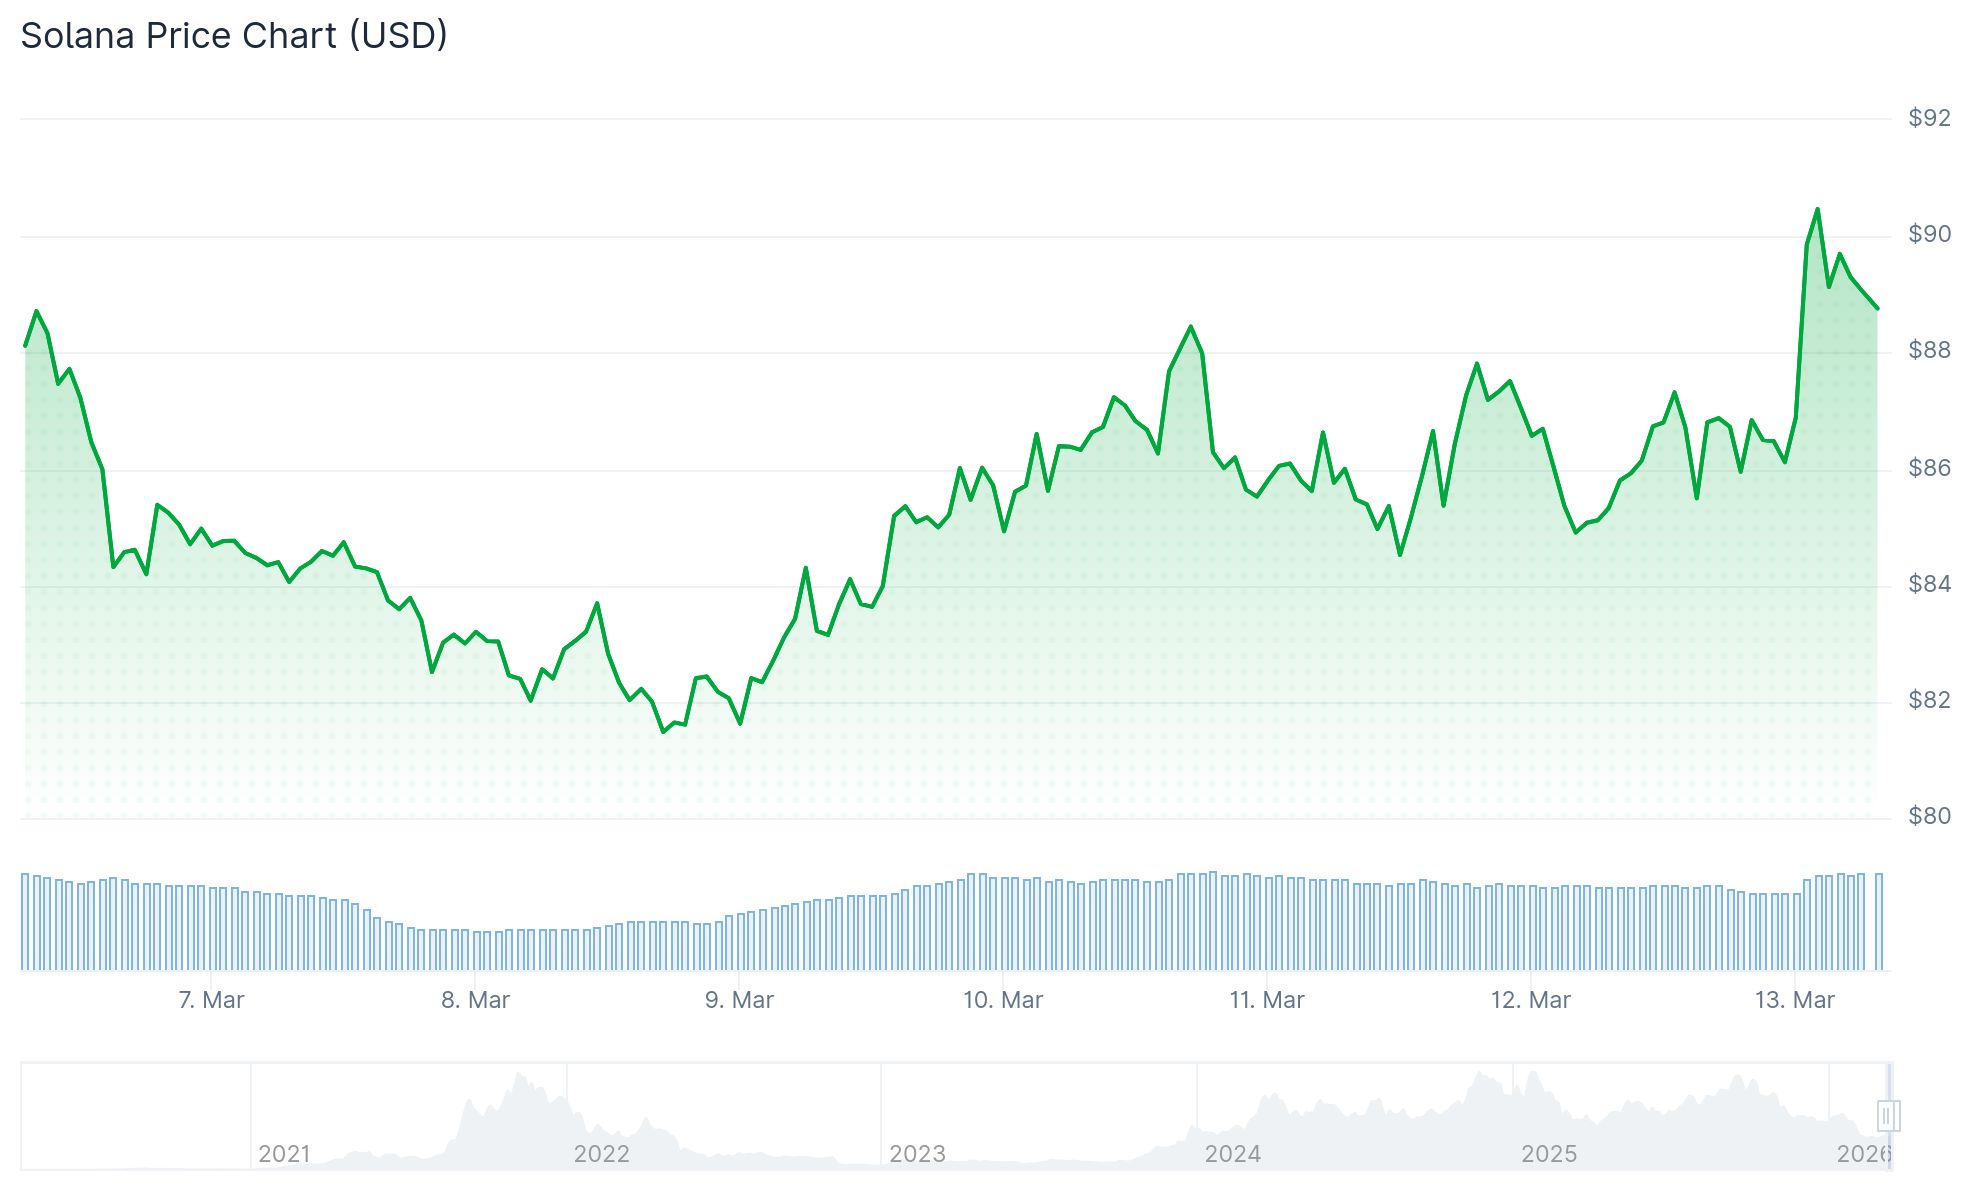
- SOL currently trades in the $88–$90 range following a weekly gain of approximately 10%
- Daily chart shows Bollinger Bands compression suggesting imminent volatility expansion
- Bulls are targeting $95 as the crucial resistance that could determine trend direction
- Thursday’s spot SOL ETF activity recorded $3.92 million in net inflows, continuing a five-week positive streak
- Futures market data reveals increasingly bullish positioning with long exposure hitting monthly peaks
As of March 13, 2026, Solana (SOL) is hovering around the $90 mark, registering nearly a 10% increase over the previous seven days. The cryptocurrency has been confined within a descending channel pattern, establishing a trading range between approximately $77 and $92 over recent weeks.
Technical analysis of the daily timeframe reveals a notable Bollinger Bands contraction, indicating declining volatility following SOL’s steep decline from levels above $130. Such compression patterns typically precede significant directional moves, although the exact trajectory remains uncertain at this stage.
Recent hourly chart action shows SOL successfully breaching an ascending triangle formation, overcoming the $87 resistance barrier. The asset climbed to an intraday peak of $91.12 before experiencing minor retracement. Currently, SOL maintains its position above $88 and remains supported by the 100-hour simple moving average.
$95 Resistance Is the Level to Watch
Market analysts have pinpointed $95 as the critical threshold for Solana’s next directional move. This price zone represents the convergence of a descending trendline and a historically significant horizontal resistance area.
Should SOL manage a decisive close above $95 with sustained momentum, the technical picture could transition from bearish to bullish. Successfully breaching this barrier would likely clear the path toward the $98–$100 zone, with $102 representing the subsequent target level.
Conversely, failure to maintain support above $88 would bring the $87.40 level into play as immediate support. A decisive breakdown below $85 could trigger a retest of the $77 area, marking the lower boundary of the established channel.
ETF Inflows and Derivatives Support the Bullish Case
Institutional participation in Solana continues to expand. Spot SOL exchange-traded funds attracted $3.92 million in new capital on Thursday, building on the previous day’s $1.66 million intake. The weekly tally stands at $3.10 million, representing the fifth consecutive week of positive flows dating back to February 13.

Perpetual futures funding rates turned positive on Thursday, registering 0.0079%. This metric indicates long position holders are compensating short sellers, typically signaling optimistic market sentiment.
Friday’s long-to-short ratio for SOL climbed to 1.07, marking the highest reading in more than 30 days. Values exceeding 1.0 indicate a greater proportion of traders hold bullish positions compared to bearish ones.
The daily Relative Strength Index has crossed above the 50 midpoint, suggesting strengthening upward momentum. Meanwhile, the MACD indicator remains in positive territory with the signal line confirming renewed bullish pressure.
Based on SoSoValue tracking data, Solana’s spot exchange-traded funds have now recorded five uninterrupted weeks of net positive capital flows beginning February 13.