
 Targets $88 Resistance Following 6% Surge — Critical Levels Ahead")
Key Highlights
- SOL climbed past the $82 and $85 thresholds following a technical pattern breakout on shorter timeframes.
- The token peaked at $87.04 before encountering resistance and settling around mid-$80 levels.
- Bulls face a critical test at the $87.20 to $88 resistance barrier.
- Downside protection exists at $83.75, followed by $82.70 and $80 if selling pressure intensifies.
- Technical indicators present conflicting signals, with near-term bullish momentum offset by longer-term bearish trends.
Solana (SOL) posted notable gains on April 8, breaking through the $82 and $85 price points as buyers regained control of the short-term trend. The upward momentum positioned the digital asset favorably within its recent trading range.
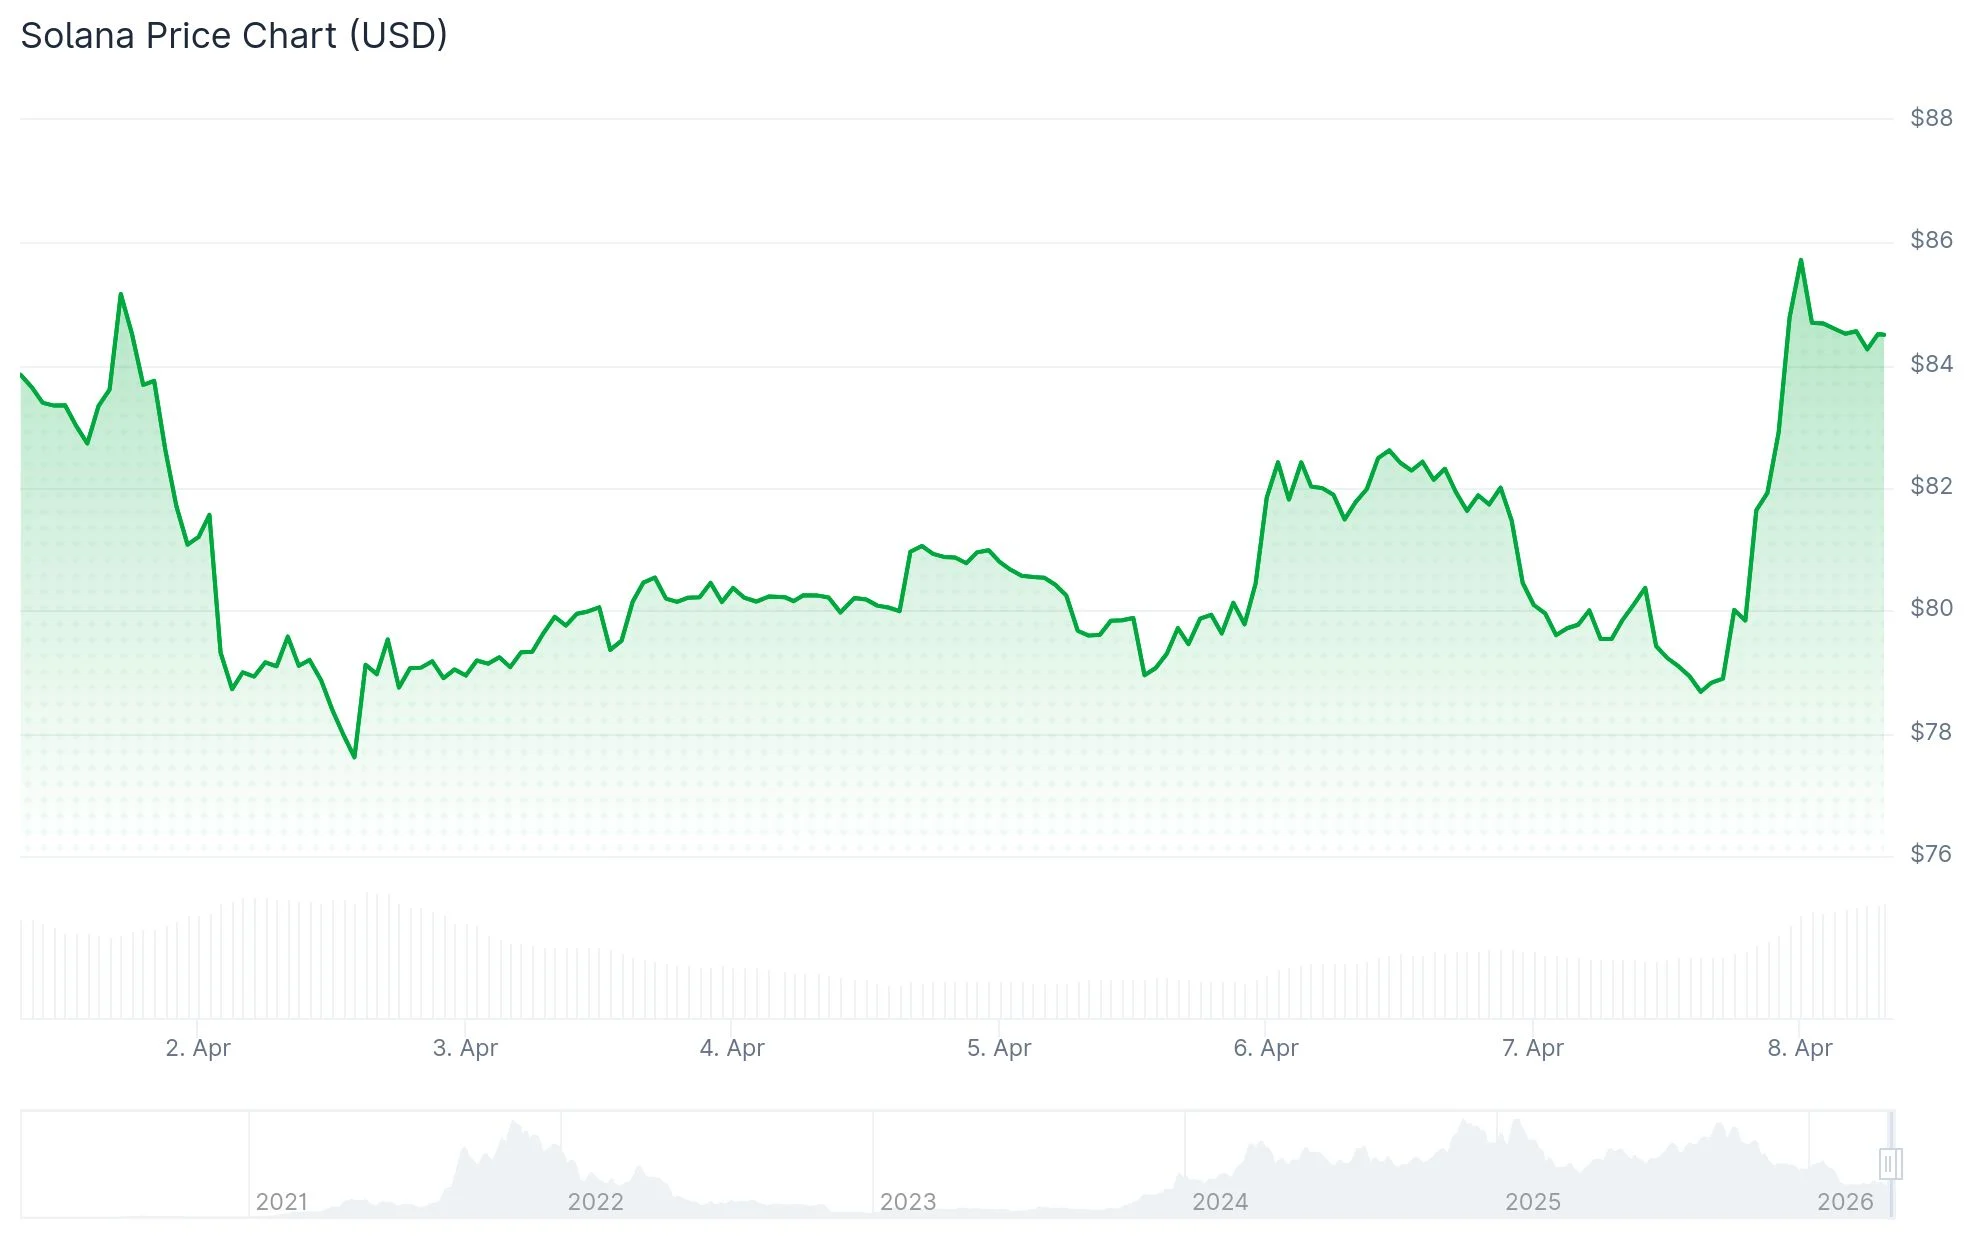
The cryptocurrency topped out at $87.04 during the session before experiencing a modest pullback. As consolidation set in, SOL maintained ground between $84 and $85, preserving the majority of its intraday advance.
Technical analysis of the hourly timeframe revealed SOL clearing a bullish flag formation, with the pattern’s resistance line positioned at $80. This technical breakout catalyzed the subsequent price appreciation.
The token currently trades above its 100-hour simple moving average, a technical signal that reinforces the bullish case and draws focus to upcoming resistance zones.
Immediate overhead resistance materializes around the $85 mark, while the primary challenge lies near $88.
A successful breach of $88 would expose subsequent resistance targets at $95 and $102. Sustained bullish momentum beyond those levels could propel SOL toward the $112 region.
Intraday gains confront technical hurdles
Market data showed Solana advancing 5.85% to reach $84.18 during trading hours. At this price level, the cryptocurrency remains just beneath both its 20-day and 50-day exponential moving averages.
The 200-day moving average sits considerably higher at $134.10, illustrating the longer-term downtrend. Technical charts identify the Ichimoku Kijun line near $87.19 as the next immediate hurdle.
This places emphasis squarely on the $87.20 to $88 price zone. SOL continues working to penetrate this resistance band.
Technical momentum oscillators presented contradictory readings. While the RSI exhibited mild bullish tendencies, both the Stochastic RSI and BBP flashed overbought warnings following the sharp rally.
Analysts suggested a probable consolidation range between $83.50 and $86.50 unless price action generates a decisive breakout. This assessment aligns with current post-rally consolidation behavior.
Downside buffers remain intact
Should Solana encounter rejection at $88, bearish pressure could reemerge. The first line of defense appears around $83.75.
A more substantial support zone exists near $82.70, which corresponds with the 50% Fibonacci retracement level calculated from the $78.38 low to the $87.04 high. The psychological $80 level represents another critical support benchmark.
A daily close beneath $80 would likely trigger additional selling toward $75, effectively erasing the recent recovery attempt.
Technical analyst Ali Charts highlighted Solana’s position within a broader consolidation channel spanning from support at $76.66 to resistance at $96.04. According to his assessment, the upcoming 48-hour period could determine April’s trajectory, with sustained support holding potentially driving moves toward $81 and $85, whereas a breakdown below $76.66 might target the $68.54 level.
Broader developments included new security initiatives launched by the Solana Foundation alongside recent regulatory developments in the United States. However, immediate market attention remains concentrated on technical price action: SOL’s rally to $87.04 and the current test of whether buying interest can overcome the $87.20 to $88 resistance barrier.