
 Rebounds From $75 Low as Fibonacci Support Holds and ETF Demand Grows")
TLDR
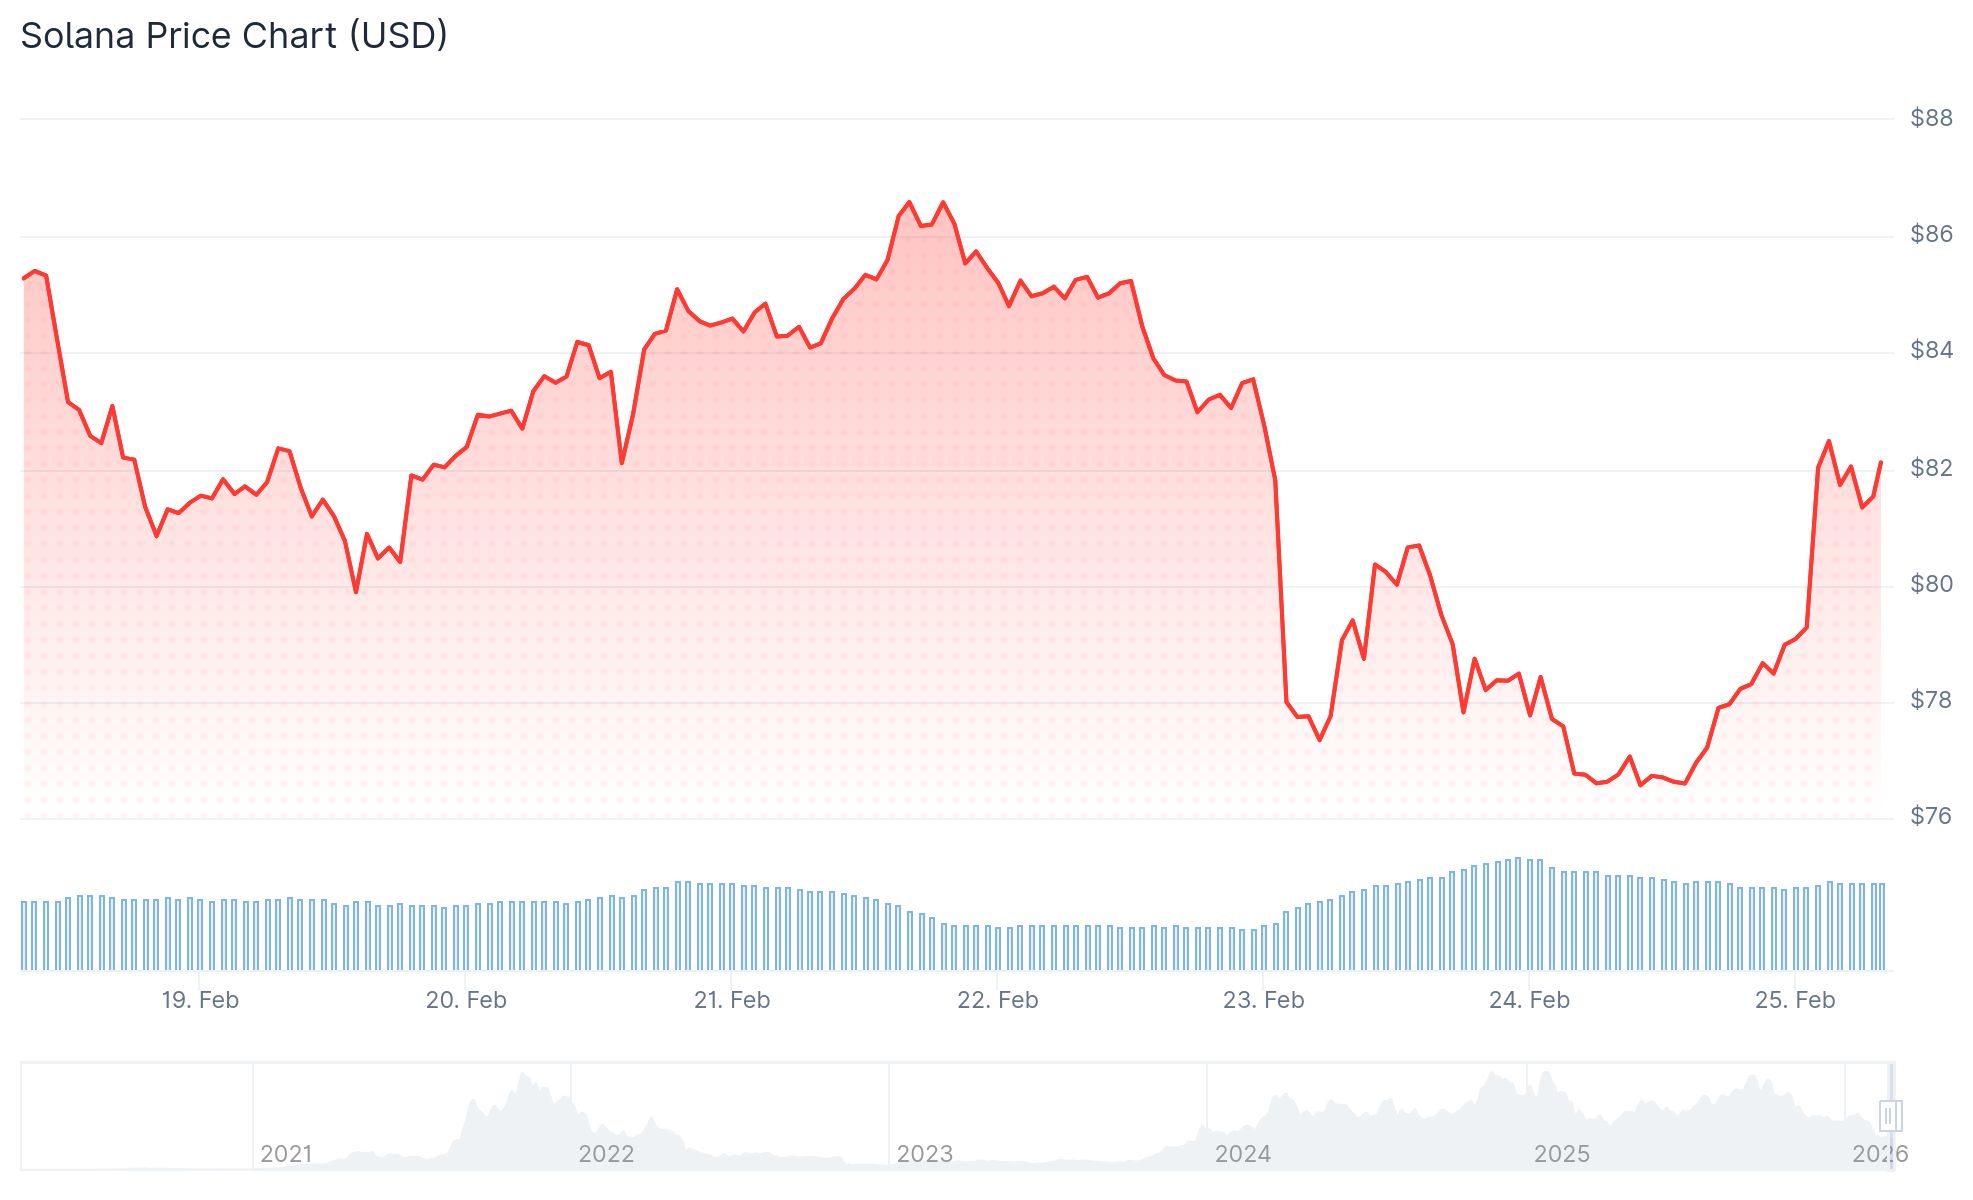
- Solana (SOL) has bounced back to the $80 level following a decline to $75.64
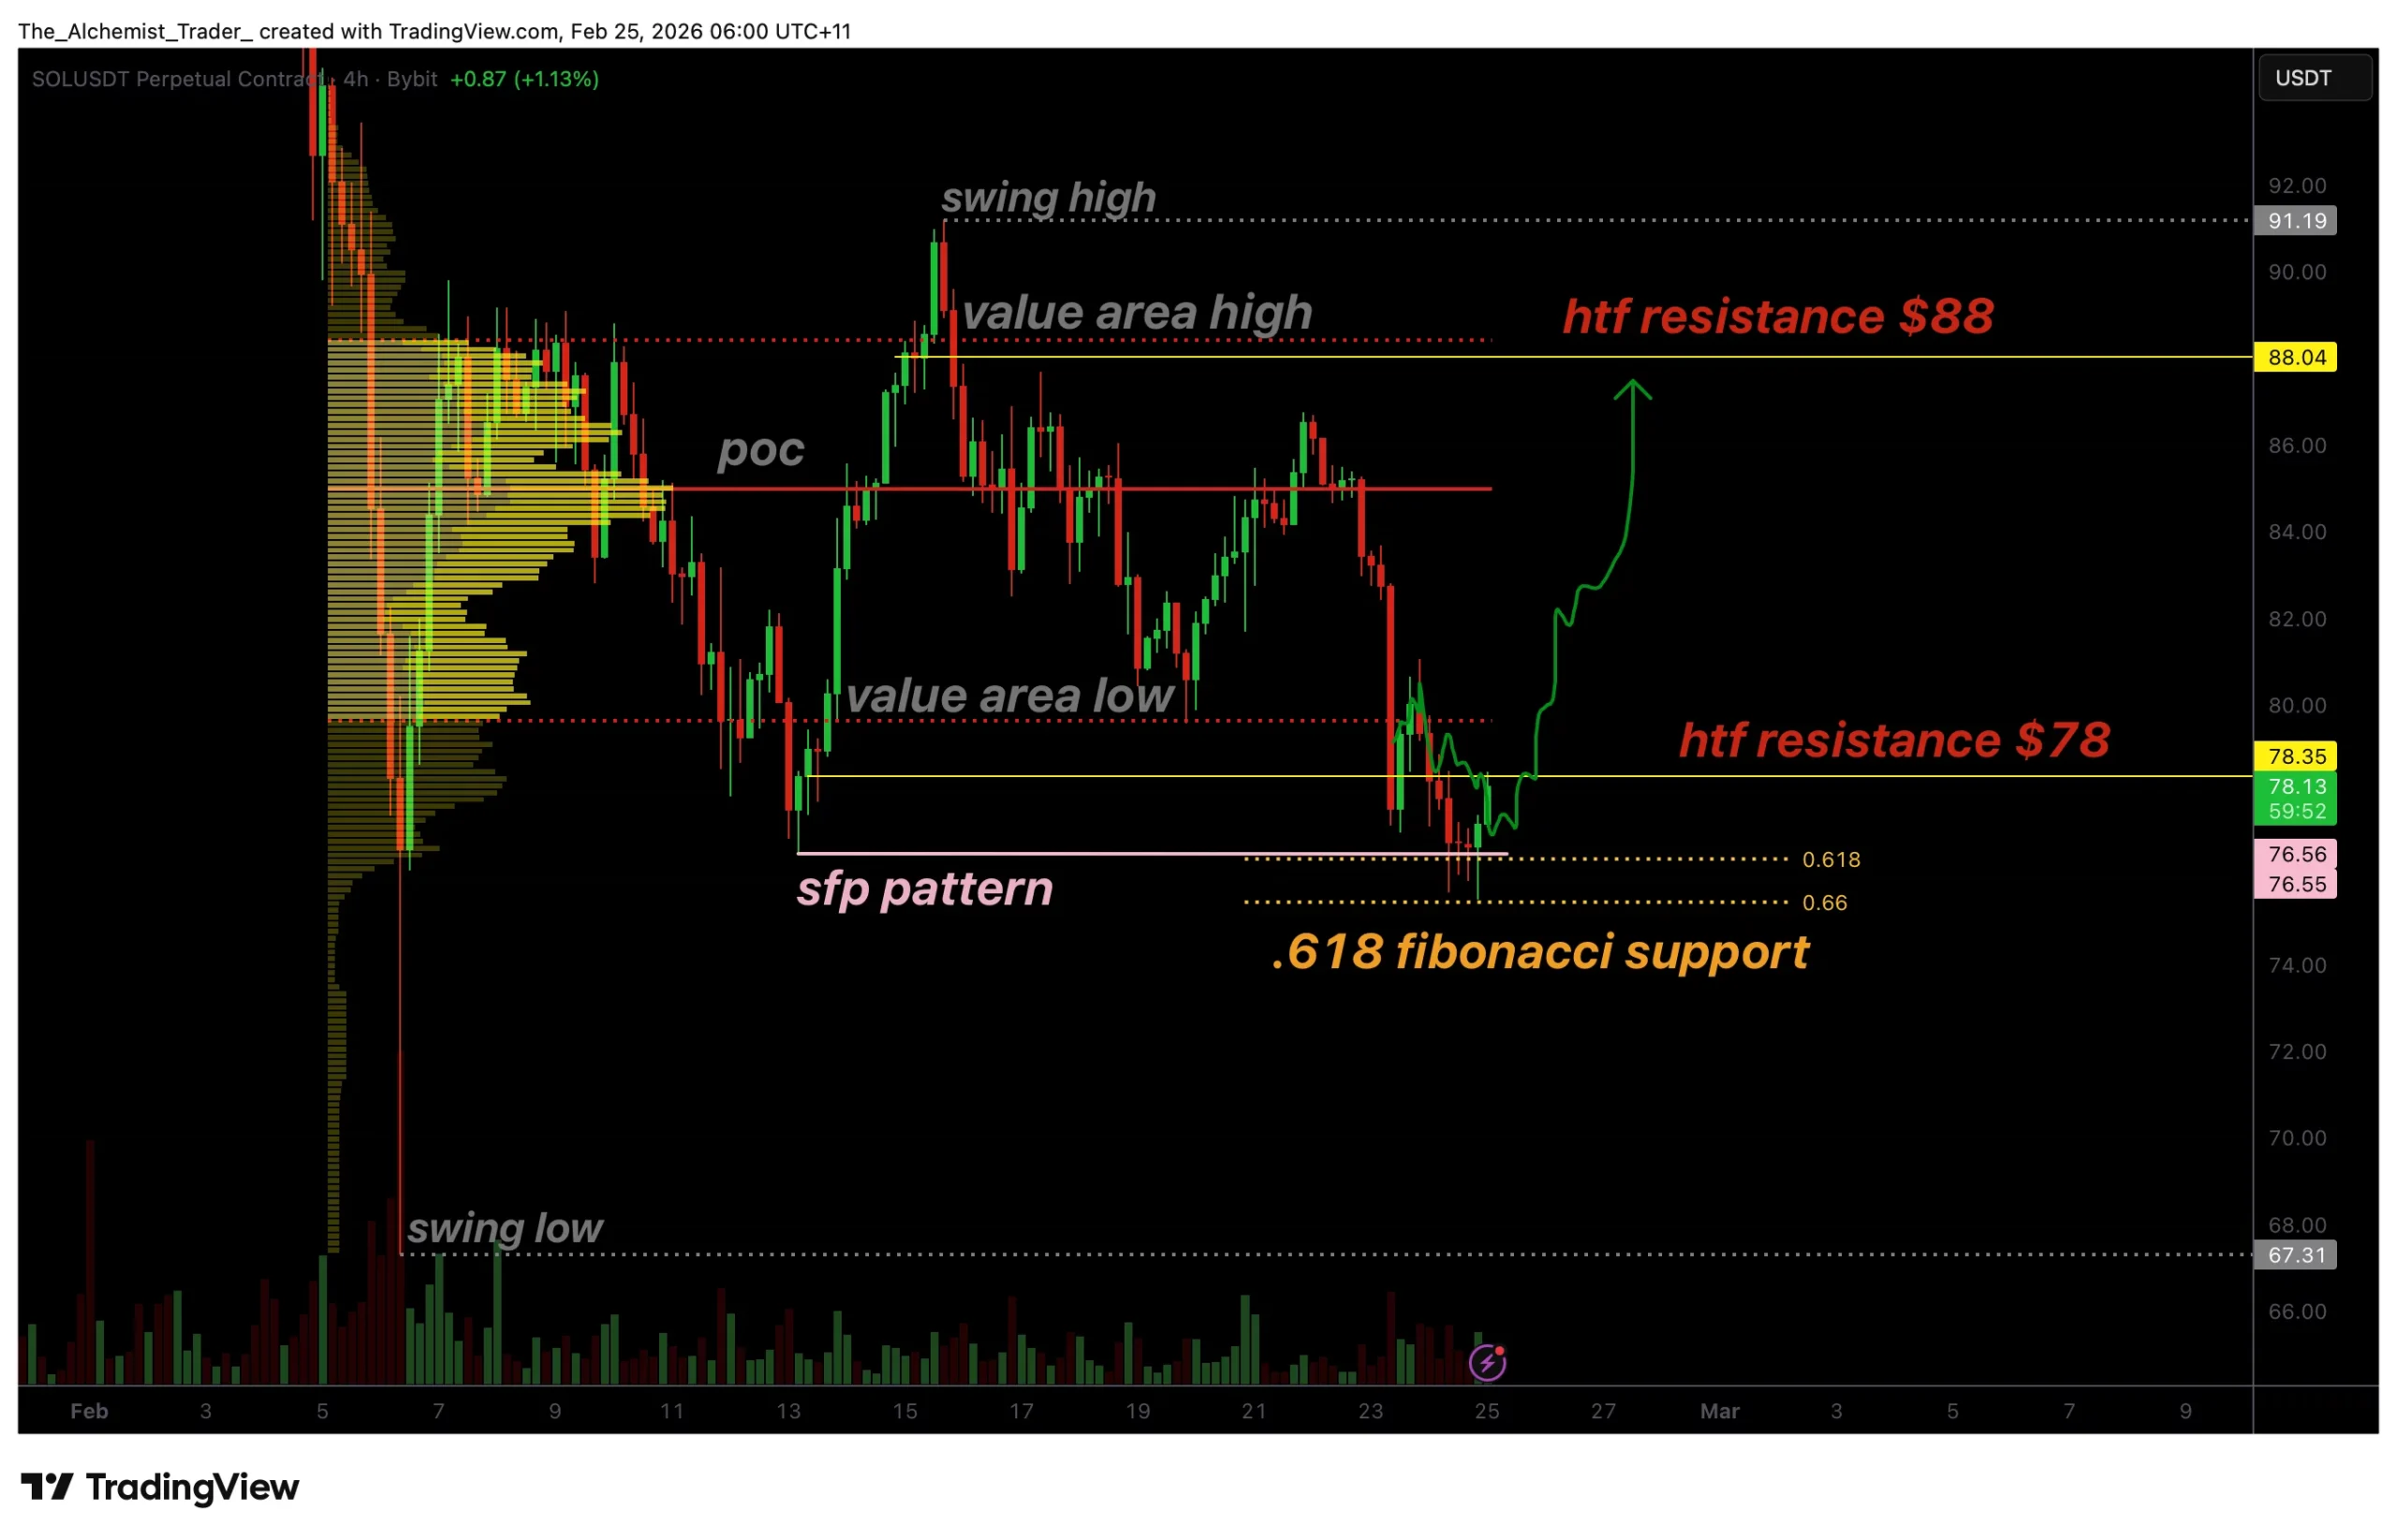
- Technical analysis reveals a swing failure pattern (SFP) at the 0.618 Fibonacci support zone, indicating possible short-term bounce
- Important resistance zones include $82, $84, and $85, with potential targets at $92 and $95 if momentum continues
- Maintaining price action above $78–$82 will be essential to validate any bullish momentum
- The Bitwise BSOL staking ETF attracted more than $3 million in net inflows on February 23, despite SOL’s ~41% decline over the past quarter
Solana has initiated a rebound following its descent to $75.64. The digital asset has successfully reclaimed the $80 threshold and currently trades above its 100-hourly simple moving average.
The recovery materialized after SOL penetrated a descending trend line that had been acting as resistance around $81 on the hourly timeframe.
The cryptocurrency also surpassed the 50% Fibonacci retracement of the decline from $86.68 down to $75.64. This development offers modest encouragement for near-term price momentum.
Resistance remains evident near $82.50, which corresponds with the 61.8% Fibonacci retracement zone. This area represents the immediate challenge for buyers attempting to extend gains.
A swing failure pattern (SFP) has developed at the 0.618 Fibonacci support level. This technical formation occurs when price temporarily penetrates a previous low, triggers stop-loss orders, then rapidly reverses direction.
Several downside wicks visible on the chart indicate that bearish pressure attempted to drive prices lower but lacked the strength to maintain control. Demand emerged to counteract the selling activity.
This formation suggests a potential local floor may be establishing, although additional confirmation remains necessary.
$78 Is the Key Level to Watch
For this rebound to establish legitimacy, SOL must recapture and defend the $78 level. This price point represents local resistance and serves as a critical inflection point for near-term trajectory.
Maintaining support above $78 would also position SOL above the value area low, a metric employed in volume profile analysis to assess buyer strength.
Should $78 prove durable, the subsequent upside objective becomes $88. This level corresponds with previous distribution areas and would signify a substantial recovery from present prices.
Beyond that point, resistance emerges at $92 followed by $95. However, a decisive close above $85 would be necessary first to make those higher levels accessible.
BSOL ETF Sees Inflows Despite Price Drop
Regarding institutional activity, Bitwise’s Solana Staking ETF (BSOL) registered $3,048,570 in net inflows on February 23, 2026.
This addition brings the fund’s total assets under management to $490,255,220. The single-day inflow accounts for approximately 0.62% of total AUM.
This institutional interest persisted even though SOL has declined approximately 41% during the previous three-month period. Technical indicators for SOL-USD were displaying a Strong Sell signal during this timeframe.
Should SOL fail to overcome the $82 barrier, immediate support exists at $80, followed by $79. A breakdown beneath $79 could expose the asset to further weakness toward $77 or potentially $74.
SOL was quoted at $76.57 when the BSOL inflow data was reported on February 23.