
 Rallies 10% to $89: Technical Breakout Signals Path to $110")
TLDR
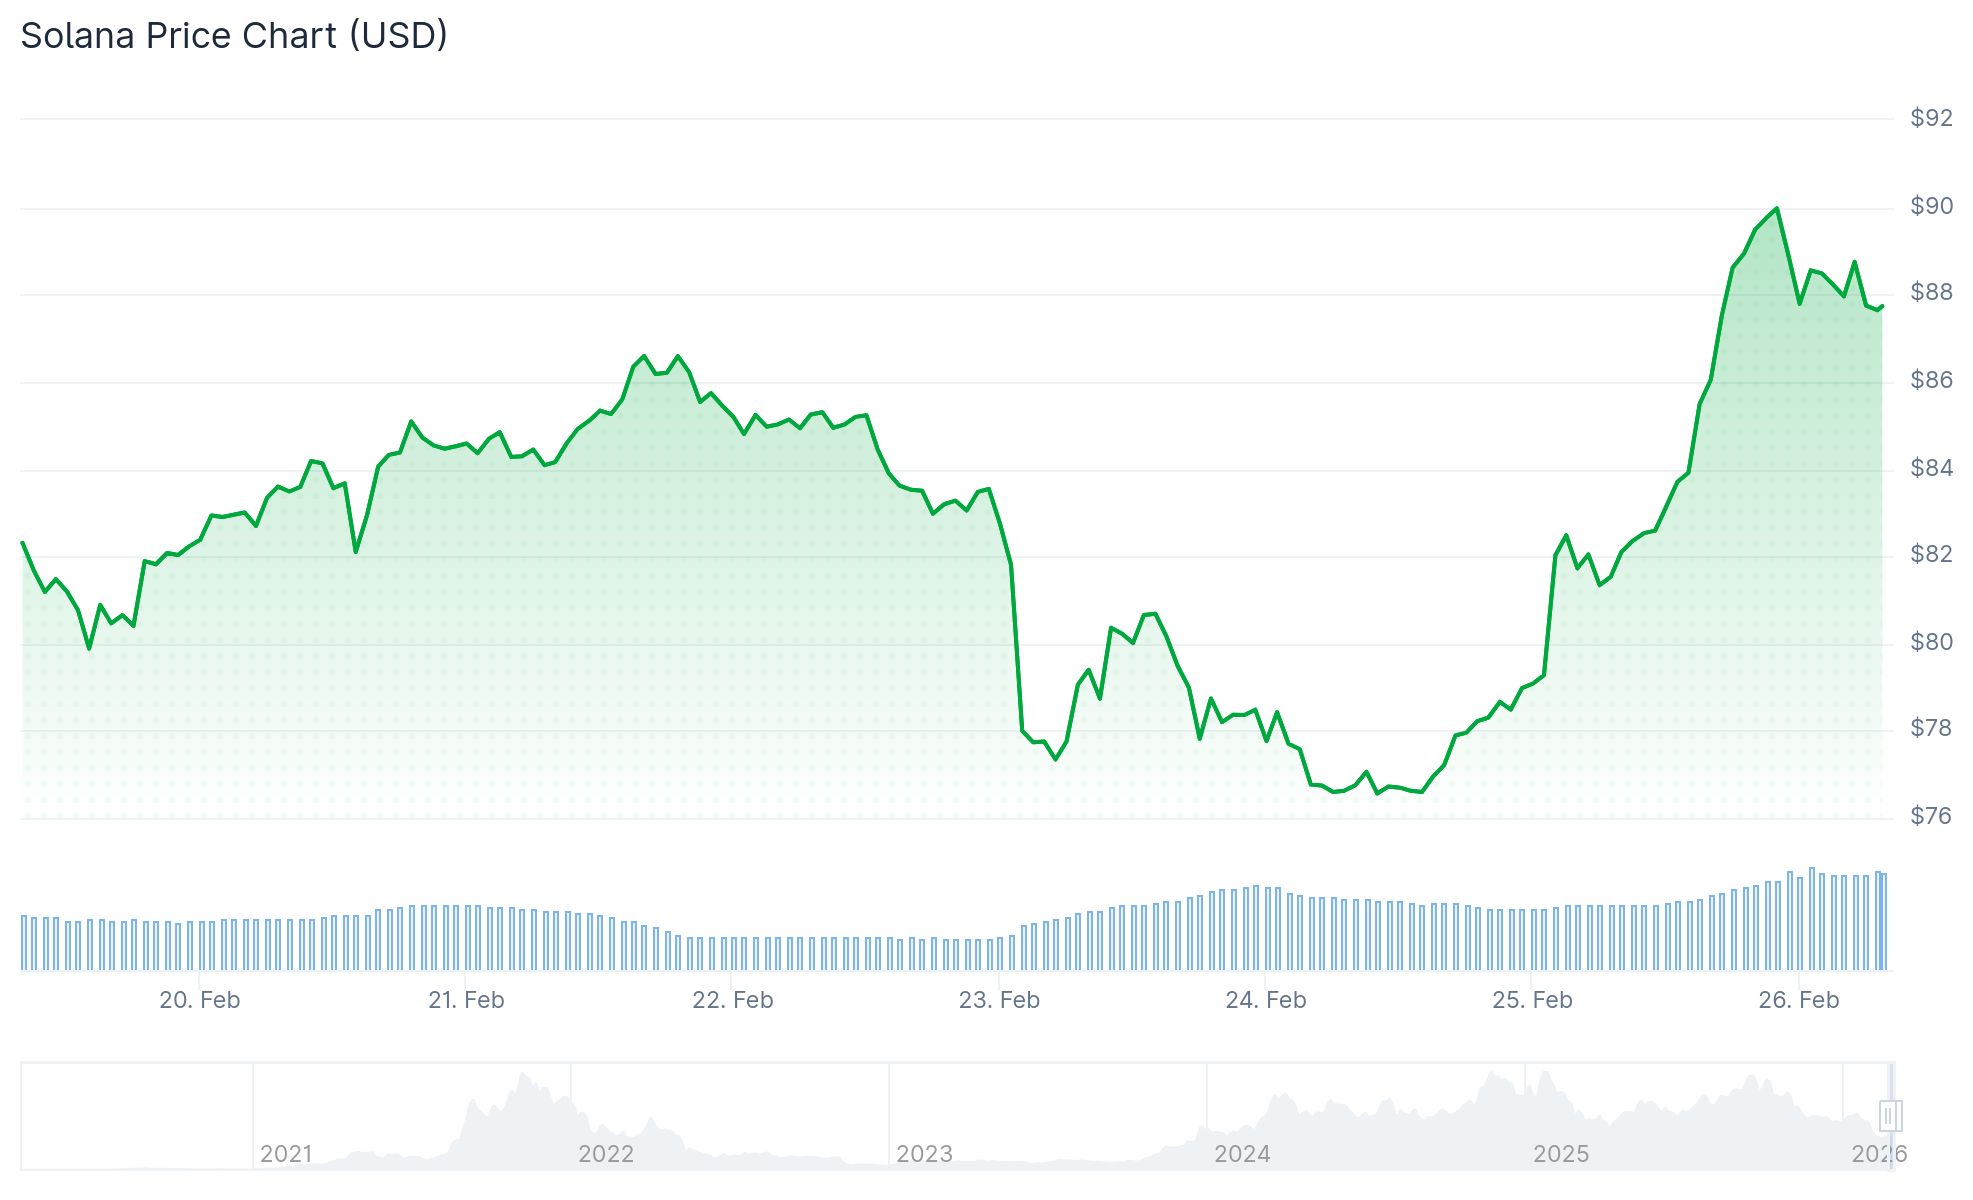
- Solana (SOL) rallied 10–13% over 24 hours, touching an intraday peak around $89
- Bitcoin’s recovery past $67K sparked widespread momentum across altcoin markets
- Spot Bitcoin ETFs in the US attracted $258 million in net inflows on February 24
- Solana-focused ETFs accumulated $40 million in net inflows starting February 9
- Critical resistance zones for SOL are positioned at $90, $95, and $100
Solana’s valuation spiked more than 10% within a single trading day, advancing from a two-week bottom of $75 to reach an intraday peak close to $89. This upward movement coincided with a broader cryptocurrency market revival, elevating the total market capitalization to approximately $2.28–$2.38 trillion.
Bitcoin spearheaded the rally, advancing more than 5% to settle in the $66,800–$68,000 range. This upward trajectory generated positive momentum for leading altcoins, with Ethereum climbing 8%, XRP advancing 6%, and Dogecoin registering similar gains.
Spot Bitcoin exchange-traded funds trading in the United States captured $258 million in net inflows on February 24. Fidelity’s FBTC dominated with $82.8 million, signaling a resurgence in institutional appetite.
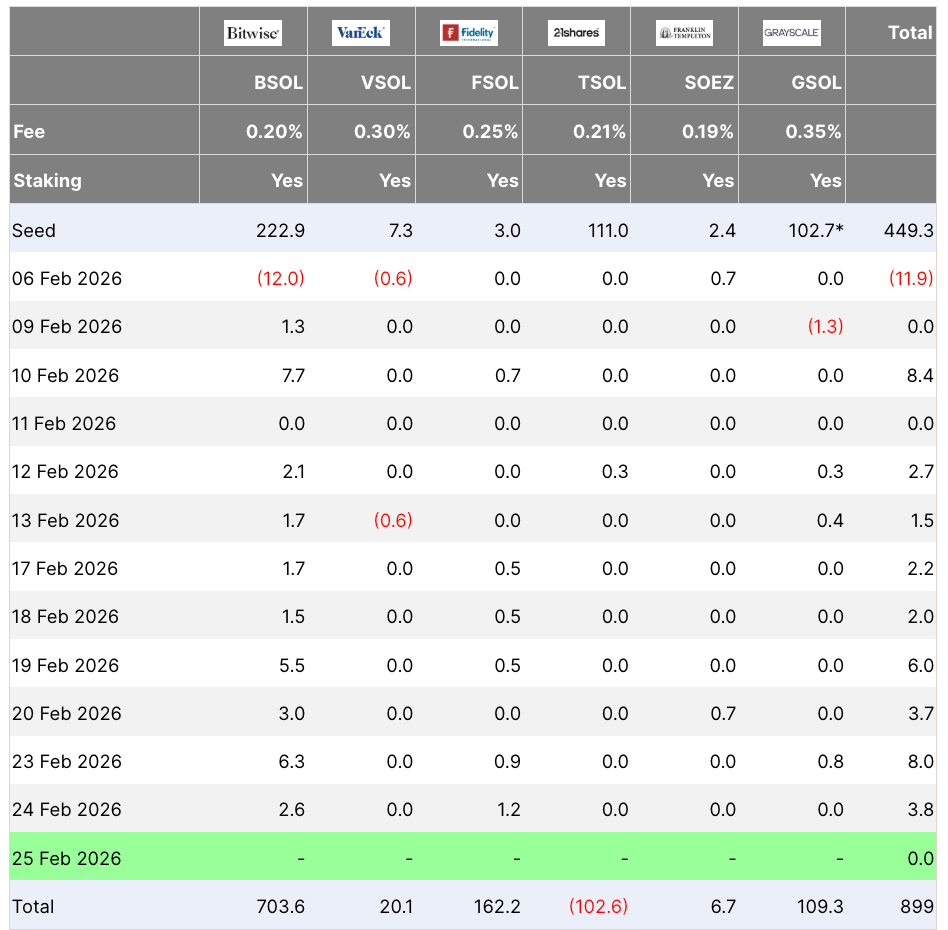
Demand specific to Solana also intensified. Spot Solana ETFs have accumulated $40 million in net inflows beginning February 9, contributing additional upward pressure on SOL’s price action.
SOL’s open interest climbed over 5% to reach $5.27 billion concurrent with the price rally. Forced liquidations of short positions amounted to $15.4 million during the identical 24-hour window.
Technical Breakout in Play
Analyzing the six-hour timeframe, SOL successfully breached resistance from a symmetrical triangle formation. The projected target derived from this breakout extends to $110, which corresponds with the 50-day simple moving average position.
Maintaining this trajectory requires price action to defend the 100-day SMA positioned at $86. A confirmed daily close exceeding the 20-day EMA at $88 might establish momentum toward $95 and subsequently $117, market analysts suggest.
Glassnode analytics reveal minimal historical accumulation activity beyond $85, indicating fewer holders maintaining unrealized losses in that price zone. This dynamic could diminish selling pressure from overhead supply in the immediate term.
The RSI registered 72.84 during reporting, penetrating overbought territory. The MACD indicator displayed a bullish crossover with a histogram value approximately 1.20.
What Needs to Happen Next
Market analysts indicate that Bitcoin establishing a sustained position above $72,000 could serve as the catalyst for Solana’s subsequent advance toward $100.
Immediate resistance for Solana resides at $90, followed by $95, with $100 representing a crucial psychological threshold. The subsequent major resistance barrier appears around $115, where approximately 22 million SOL tokens were historically accumulated.
Macroeconomic events scheduled this week include Thursday’s jobless claims report, Friday’s January Producer Price Index release, and appearances from eleven Federal Reserve officials.
During reporting, SOL was exchanging hands at $88.56, with a session peak of $89.19 and a trough of $85.98.