
 Faces Downward Pressure After $93 Resistance Rejection")
Key Takeaways
- SOL encountered resistance at $93 and fell 5.7% over 24 hours to approximately $87
- The cryptocurrency is positioned beneath its 20-, 50-, 100-, and 200-day moving averages
- Technical indicators (RSI, MACD) reflect diminishing price momentum
- A developing bearish flag formation on daily charts suggests potential decline to $40–$45
- Network handled 44% of worldwide crypto transactions despite declining price action
Solana (SOL) faces mounting selling pressure following an unsuccessful attempt to surpass the $93 resistance threshold. The cryptocurrency has retreated from this level and is now testing a critical support zone that market participants are monitoring intensely.
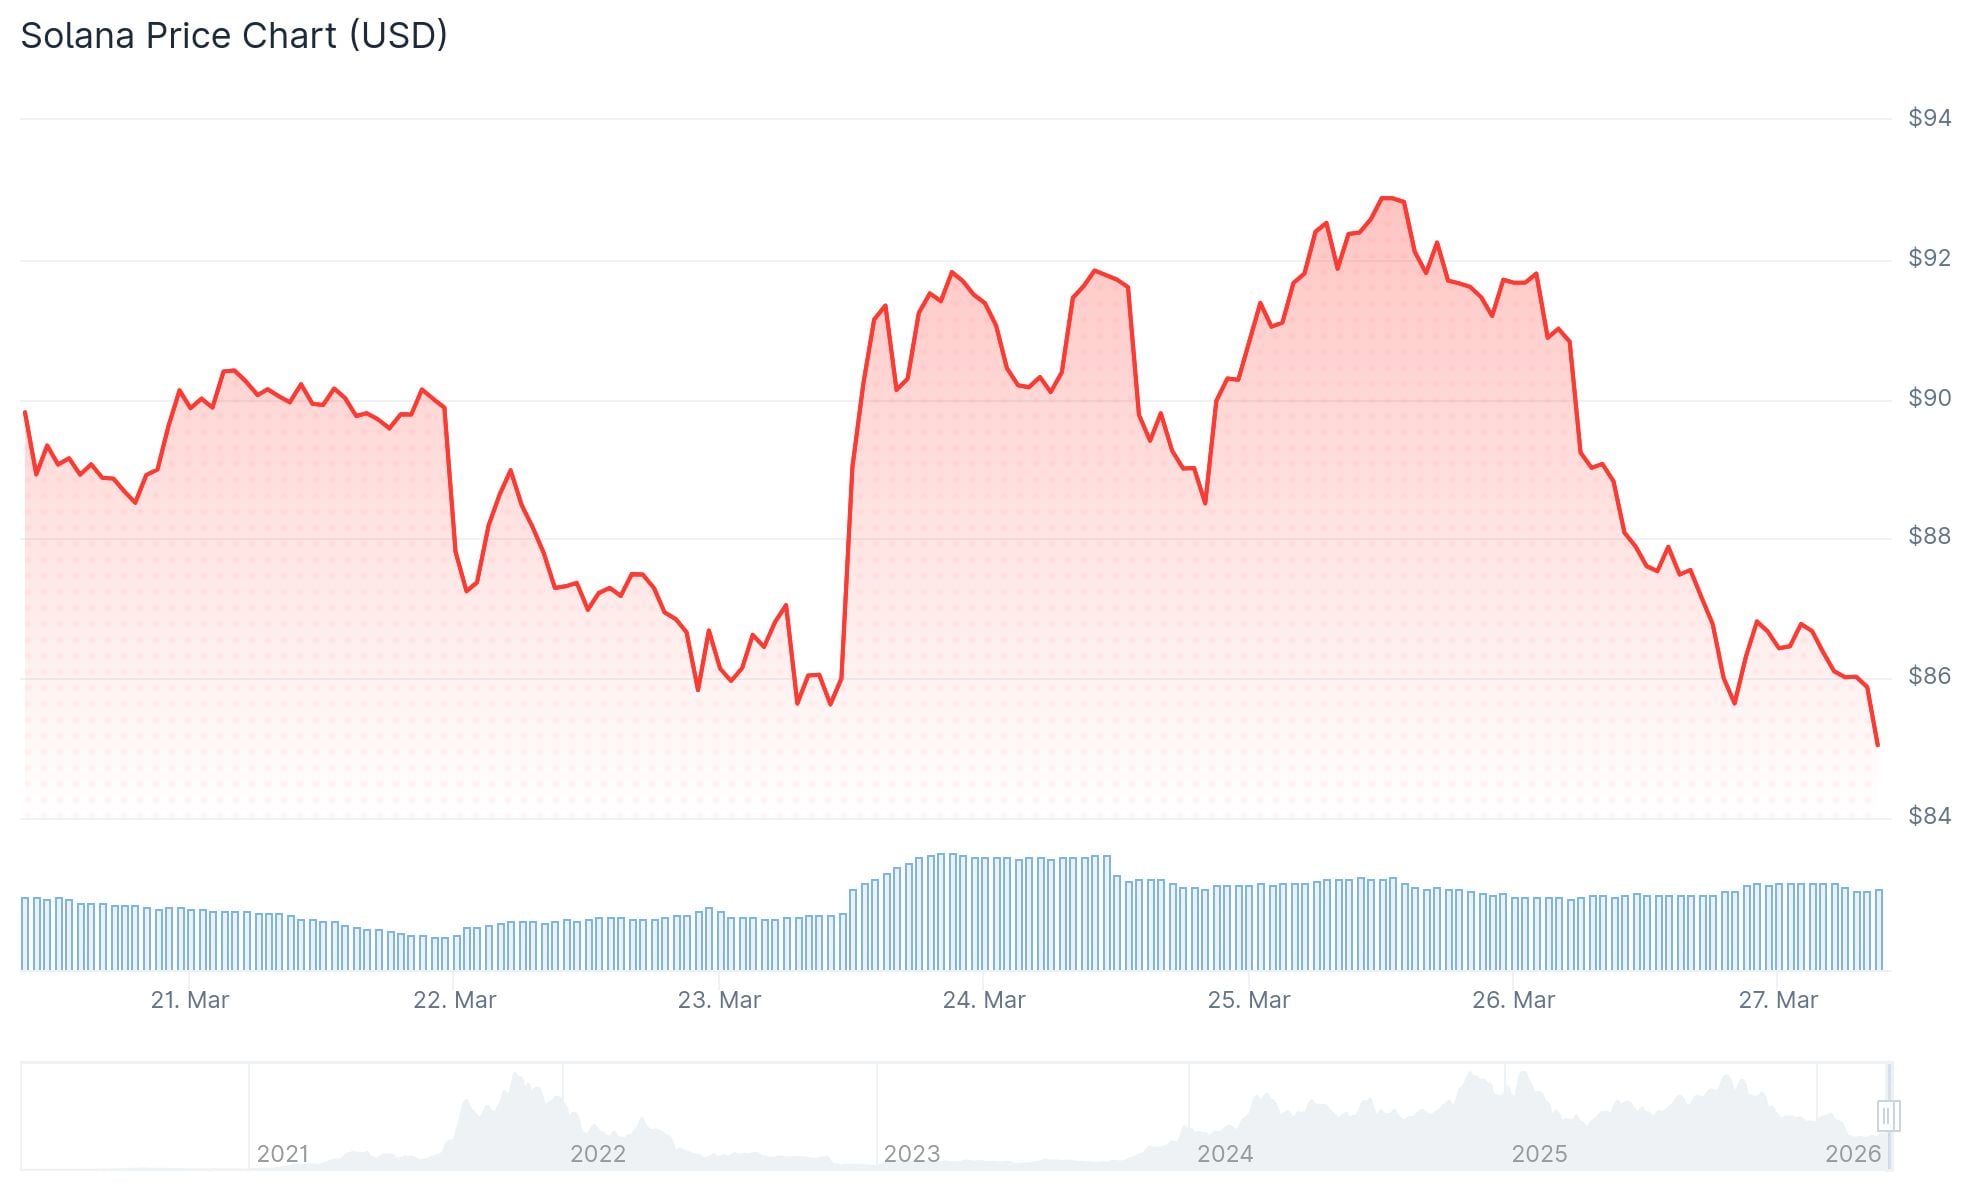
Currently, SOL is valued at $87.45. The past 24 hours recorded a trading volume of $5.62 billion, while the cryptocurrency maintains a market capitalization of $50.21 billion. Price action shows a 5.70% decrease during this period.
Cryptocurrency analyst BitGuru highlighted the $93 rejection in an X platform update dated March 26, 2026. The analyst noted that SOL has retreated to a significant historical support area following the failed resistance breakthrough. The market’s response at this critical juncture will likely determine the next directional move.
Should demand materialize at current levels, SOL might stage a recovery toward upper resistance zones. Conversely, a breakdown below this support could trigger additional downside movement.
Technical Indicators Reflect Deteriorating Strength
Solana currently trades beneath every major moving average indicator. The 20-day moving average registers at $88.63, the 50-day at $86.09, the 100-day at $106.54, and the 200-day at $143.24.
Trading below both the 100- and 200-day moving averages indicates the asset remains distant from establishing consistent upward momentum.
The Relative Strength Index measures 47.66, positioned beneath its signal line of 52.54. The MACD line reads 0.127, also below its signal line of 0.232. The minimal MACD histogram activity suggests limited directional confidence from market participants.
Bearish Flag Formation Indicates Downside Potential
Technical analysis of the daily timeframe reveals an emerging bearish flag pattern — a configuration resembling one observed earlier in 2025. During that previous occurrence, Solana experienced a significant breakdown following pattern completion.
The present structure displays price consolidation within an ascending channel following a substantial decline. Should confirmation of a breakdown occur from present levels, technical projections indicate a possible move toward the $40 to $45 price zone within approximately one to two weeks.
Notwithstanding the challenging price environment, Solana’s blockchain activity demonstrates remarkable strength. The network handled 825,729,338 transactions from a total of 1,867,616,231 blockchain transactions during the analyzed timeframe — representing 44% of all global cryptocurrency transaction volume.
Analyst Ali Charts emphasized on X that more than 100 million SOL tokens changed hands between $91.45 and $82.60, identifying this range as the most critical demand area. Below this zone, essential support levels to monitor include $53.10, $35.40, and $23.60.