
 Whales Accumulate 320K Tokens While Network Activity Surges to Decade Peak")
Quick Summary
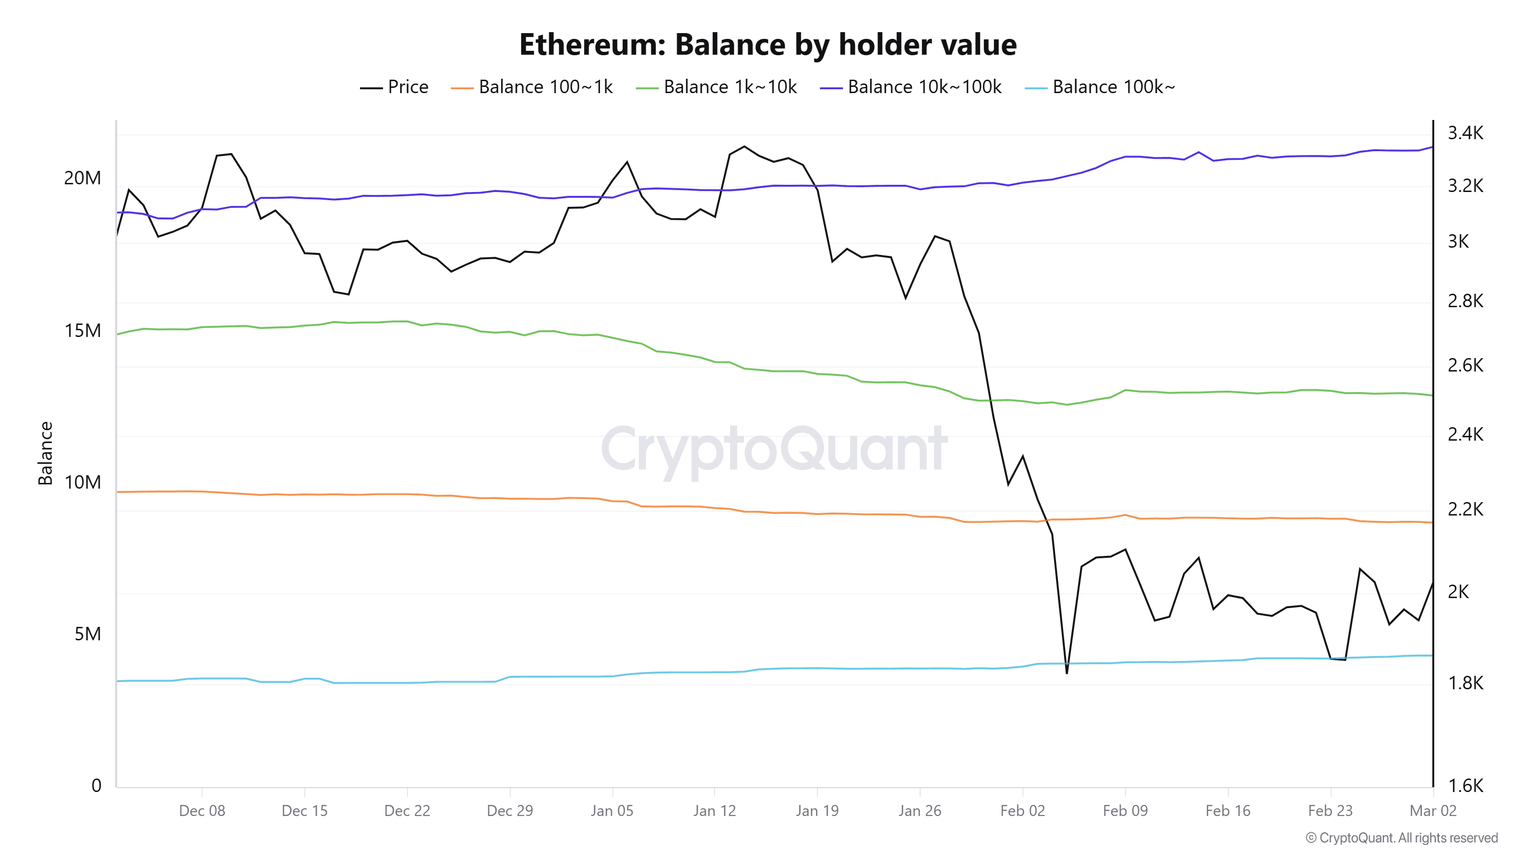
- Large Ethereum holders accumulated 320K ETH in the past week as retail traders offloaded 210K ETH
- Daily active addresses reached 837,200, marking a 10-year record high
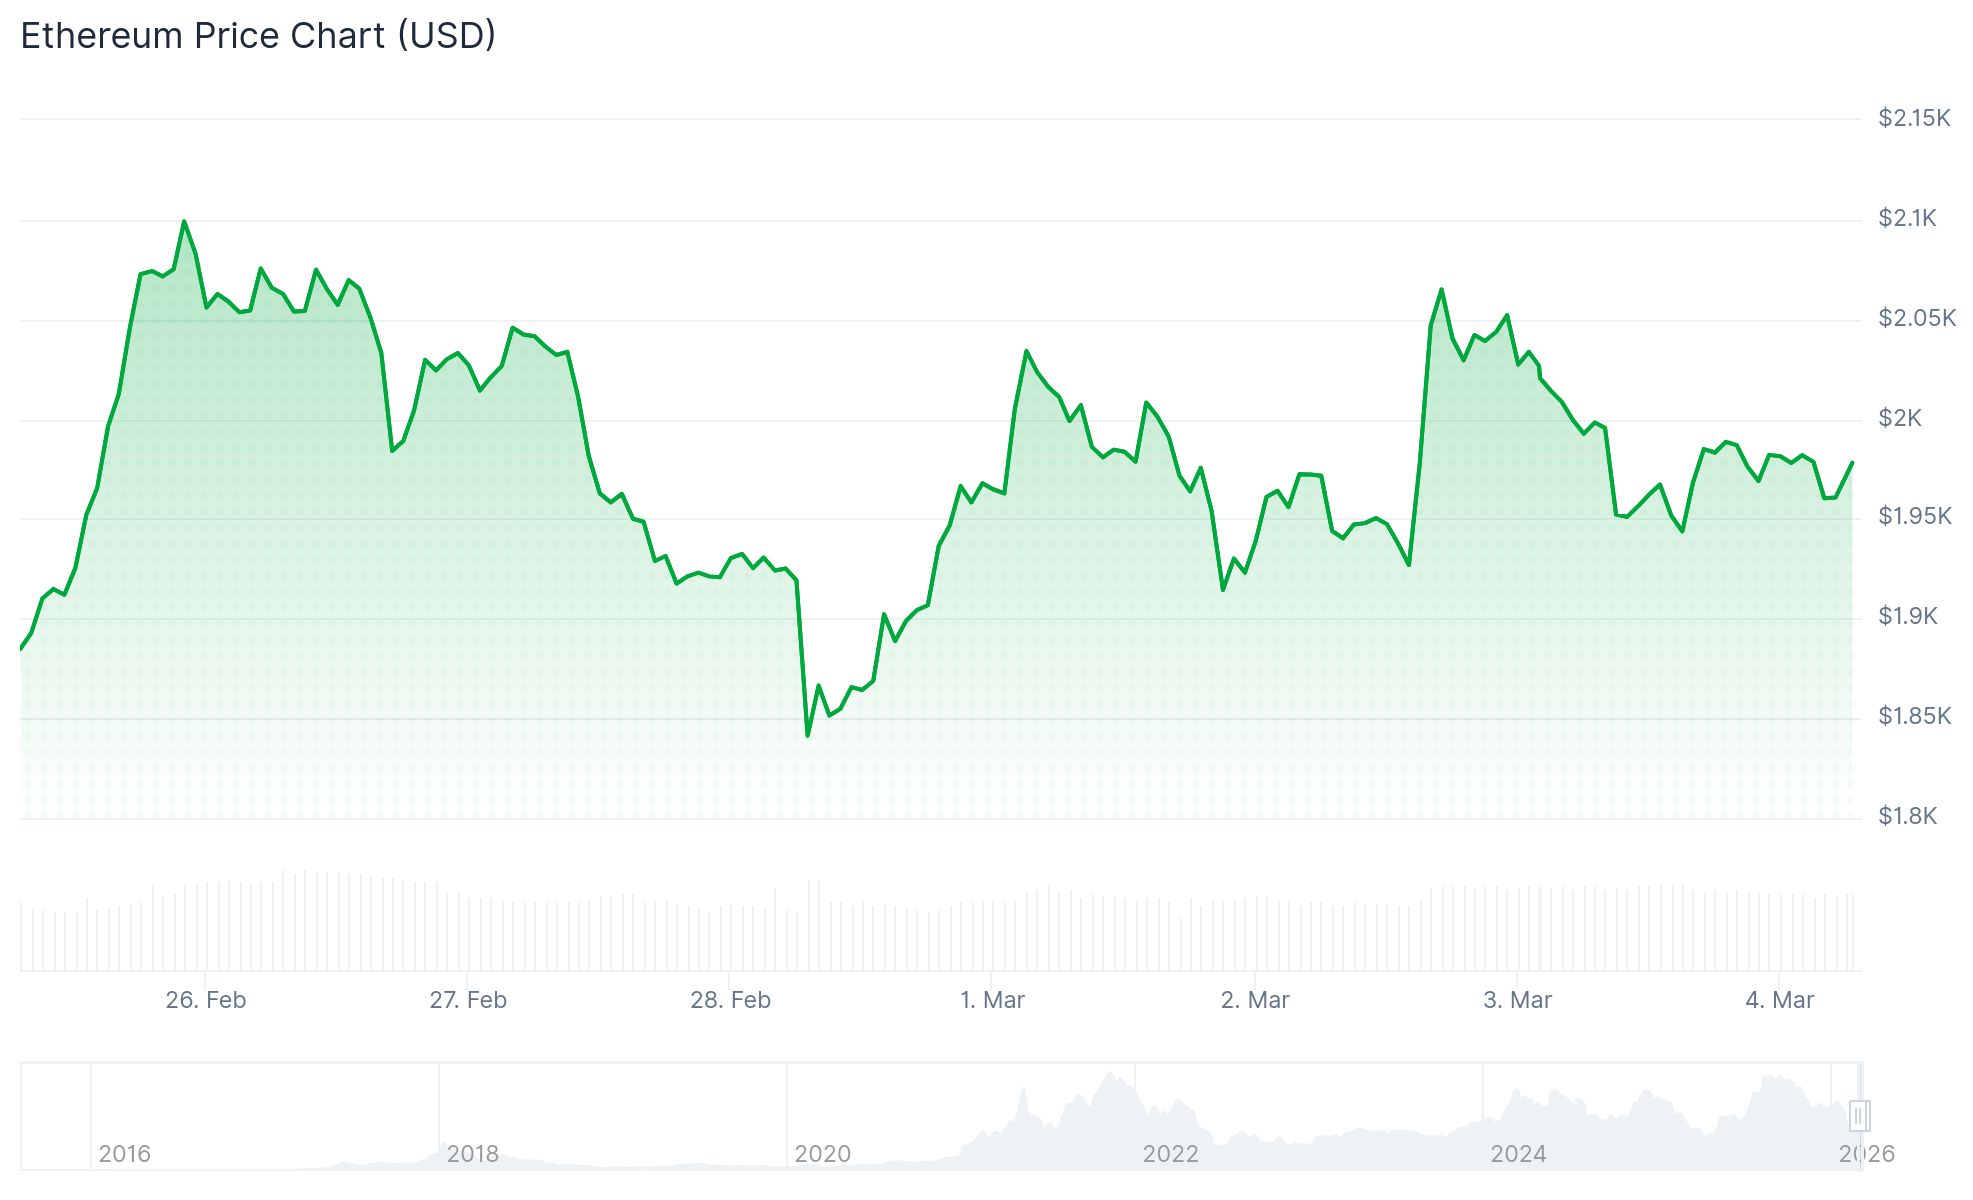
- ETH price remains stuck between $1,980–$1,990, facing resistance at the $2,000 threshold
- Spot ETH ETFs in the United States recorded $38.6 million in net inflows on Monday
- Binance short position dominance has decreased, yet ETH trades beneath critical moving averages
Ethereum continues to trade around $1,980, struggling to breach the critical $2,000 psychological barrier even as major holders increase their positions and network usage reaches historic levels.
During the past seven days, cryptocurrency wallets containing between 10,000 and 100,000 ETH accumulated an additional 120,000 ETH just on Sunday and Monday. The combined whale net accumulation for the entire week totaled 320,000 ETH. Meanwhile, smaller holders with balances ranging from 100 to 10,000 ETH distributed approximately 210,000 ETH.
United States market participants have demonstrated relative stability. The Coinbase Premium Index, a gauge for American buying pressure, remained in positive range. Monday also marked the return of positive flows for US spot ETH ETFs, which attracted $38.6 million with zero outflows reported across all nine available products.
On the Binance exchange, the proportion of short positions within ETH futures markets has declined significantly throughout the week. This indicates a reduction in traders positioning for further ETH price declines.
Network Engagement Reaches Decade-High Territory
Data from Santiment reveals that Ethereum’s daily active address metric climbed to 837,200, representing the highest level seen in ten years. This figure shows an 82% increase compared to measurements from five years earlier and a remarkable surge exceeding 1,100% from ten years ago.
The creation rate of new wallets has similarly increased by 64% over a five-year period, currently averaging approximately 284,800 fresh wallets daily. Past patterns suggest that surges in these two indicators typically coincide with extended growth cycles for ETH.
Yet the price action hasn’t followed suit. ETH continues trading significantly beneath its 50-day EMA around $2,300 and its 200-day EMA near $2,945.
Critical Price Zones Under Focus
Ethereum saw $78.3 million in total liquidations during the previous 24-hour period. Long position liquidations accounted for $48 million of that total.
The Relative Strength Index currently registers around 43, indicating subdued momentum without reaching oversold territory. Important resistance zones are located at $2,020, $2,050, and $2,080. Successfully clearing $2,120 could establish a pathway toward $2,200.
For downside scenarios, support levels appear near $1,960, followed by $1,932. Declining below $1,895 might trigger further weakness toward $1,850 or potentially $1,820.
According to Glassnode analytics, substantial accumulation activity occurred around $1,800, with approximately 1.23 million ETH acquired at an average cost basis of $1,890 during the last 30 days.
CoinGlass metrics indicate elevated long liquidation vulnerability between $1,900 and $1,950. Conversely, short squeeze potential escalates above the $2,000 mark.
ETH’s present trading price of roughly $1,990 places it squarely within this compressed volatility zone.