
 Technical Analysis: Critical Support at $2,040 as Bearish Pattern Emerges")
Quick Summary
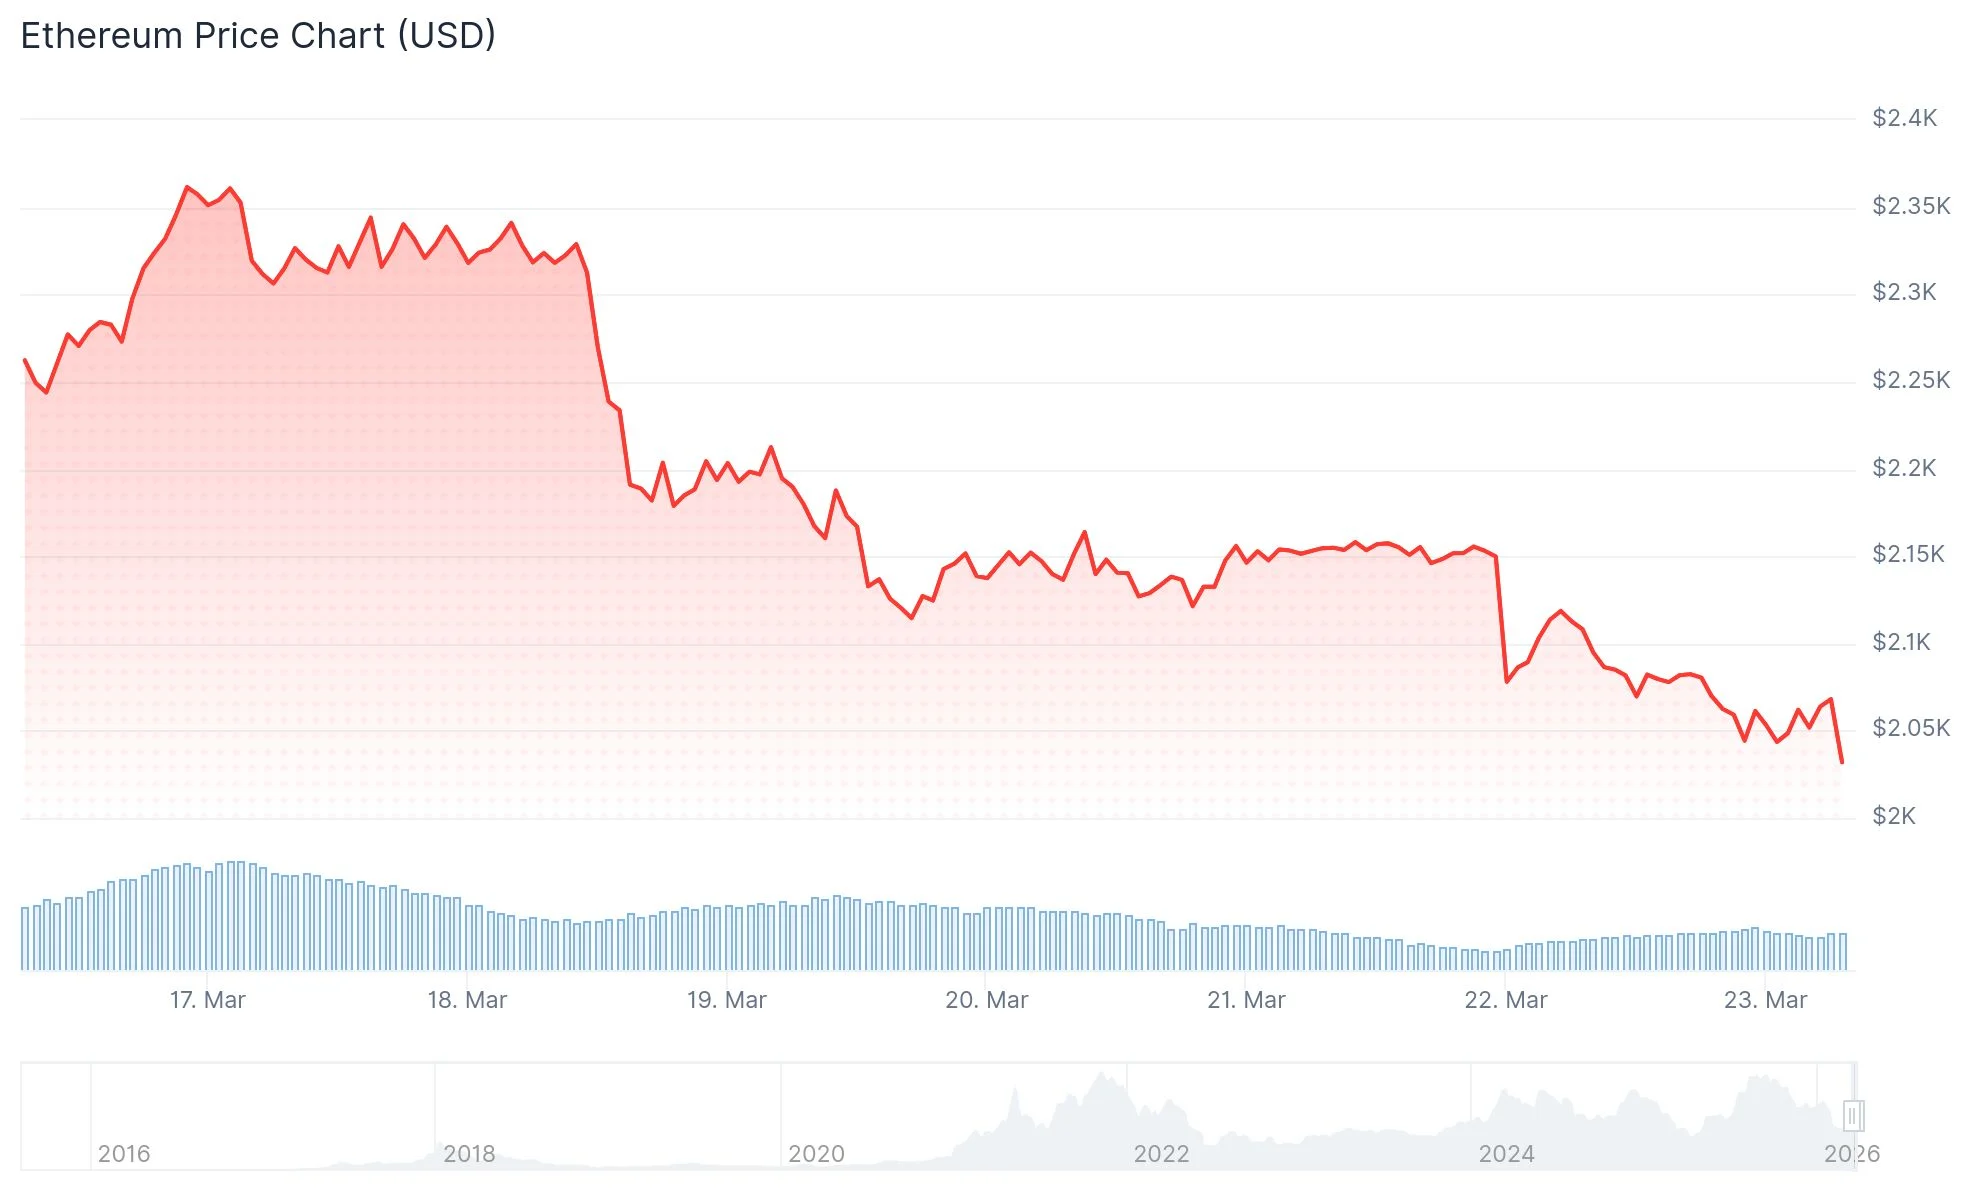
- Ethereum plunged from $2,220 to $2,025, currently consolidating between $2,020 and $2,100
- Dual bearish trendlines create resistance barriers at $2,120 and $2,165 on the hourly chart
- Breaking above $2,165 resistance could trigger a rally toward $2,200–$2,300; losing $2,025 support may accelerate decline toward $2,000
- Last week’s Ethereum spot ETF data shows $59.94 million in net outflows, with BlackRock’s ETHA accounting for $69.59 million
- Combined Ethereum spot ETF assets total $12.33 billion, representing 4.79% of ETH’s market capitalization
Ethereum experienced a significant downturn in the last 24 hours, sliding from approximately $2,385 down to $2,025. The cryptocurrency is now changing hands beneath the $2,100 mark and has fallen below its 100-hourly Simple Moving Average.
The selloff initiated after ETH struggled to maintain ground above $2,220. The digital asset breached critical levels at $2,150 and $2,120 before momentarily dipping below $2,050.
Currently, ETH is consolidating beneath the 23.6% Fibonacci retracement level calculated from the downward swing between $2,385 and $2,025. Technical analysis reveals two descending trendlines on the hourly timeframe, establishing resistance zones at $2,120 and $2,165.
The initial resistance barrier stands at $2,120, which coincides with the 100-hourly Simple Moving Average. Successfully breaking through this level would bring $2,165 into focus as the subsequent obstacle.
Should Ethereum overcome the $2,165 resistance, the 50% Fibonacci retracement level positioned around $2,200 becomes relevant. Clearing this zone could pave the way for advancement toward $2,250 or potentially $2,300.
Critical Support Zones in Focus
Looking at potential downside scenarios, the initial support zone emerges around $2,040. Beneath this level, $2,025 represents the primary support floor.
A decisive breakdown below $2,025 would shift attention to the psychological $2,000 threshold. Additional downward pressure could expose the $1,965 level, with $1,880 serving as a more substantial support base.
Technical analyst Ted Pillows shared his assessment on X, identifying a potential head and shoulders formation. His analysis stated: “$ETH seems to be forming head and shoulder pattern. If Ethereum loses the $2,040 level, expect a massive dump.”
Spot ETF Activity Signals Weakness
Ethereum spot exchange-traded funds experienced combined net outflows totaling $59.94 million during the March 16–20 trading week, based on SoSoValue statistics shared by PANews on March 23.
BlackRock’s ETHA dominated the outflow activity, recording $69.59 million in redemptions throughout the week. Despite this recent exodus, ETHA maintains a cumulative historical net inflow of $11.91 billion.
Fidelity’s FETH experienced $61.62 million in withdrawals during the identical timeframe. The fund’s aggregate historical net inflow remains at $2.32 billion.
Grayscale Ethereum Mini Trust (ETH) was the sole fund registering positive flows last week, attracting $6.87 million in fresh capital. This product has accumulated $1.85 billion in historical total net inflows.
As of March 23, the aggregate net assets across all Ethereum spot ETFs amount to $12.33 billion, accounting for 4.79% of Ethereum’s entire market capitalization. The cumulative historical net inflow for the complete ETF ecosystem stands at $11.73 billion.