
 Rallies to $2,150: Analyzing Short Squeeze, Volatility Surge and ETF Trends")
TLDR
- Ethereum reached $2,150 this week before encountering resistance across several technical metrics
- Closing above $2,100 on a daily basis remains critical, matching the realized price for wallets containing 100,000+ ETH
- The 30-day realized volatility for ETH approaches 0.97, marking the highest level observed since March 2025
- Bears are facing liquidation pressure with $220M in shorts wiped out across two days while funding rates flip positive
- Institutional selling via spot ETFs shows signs of weakening, although accumulation patterns haven’t yet materialized
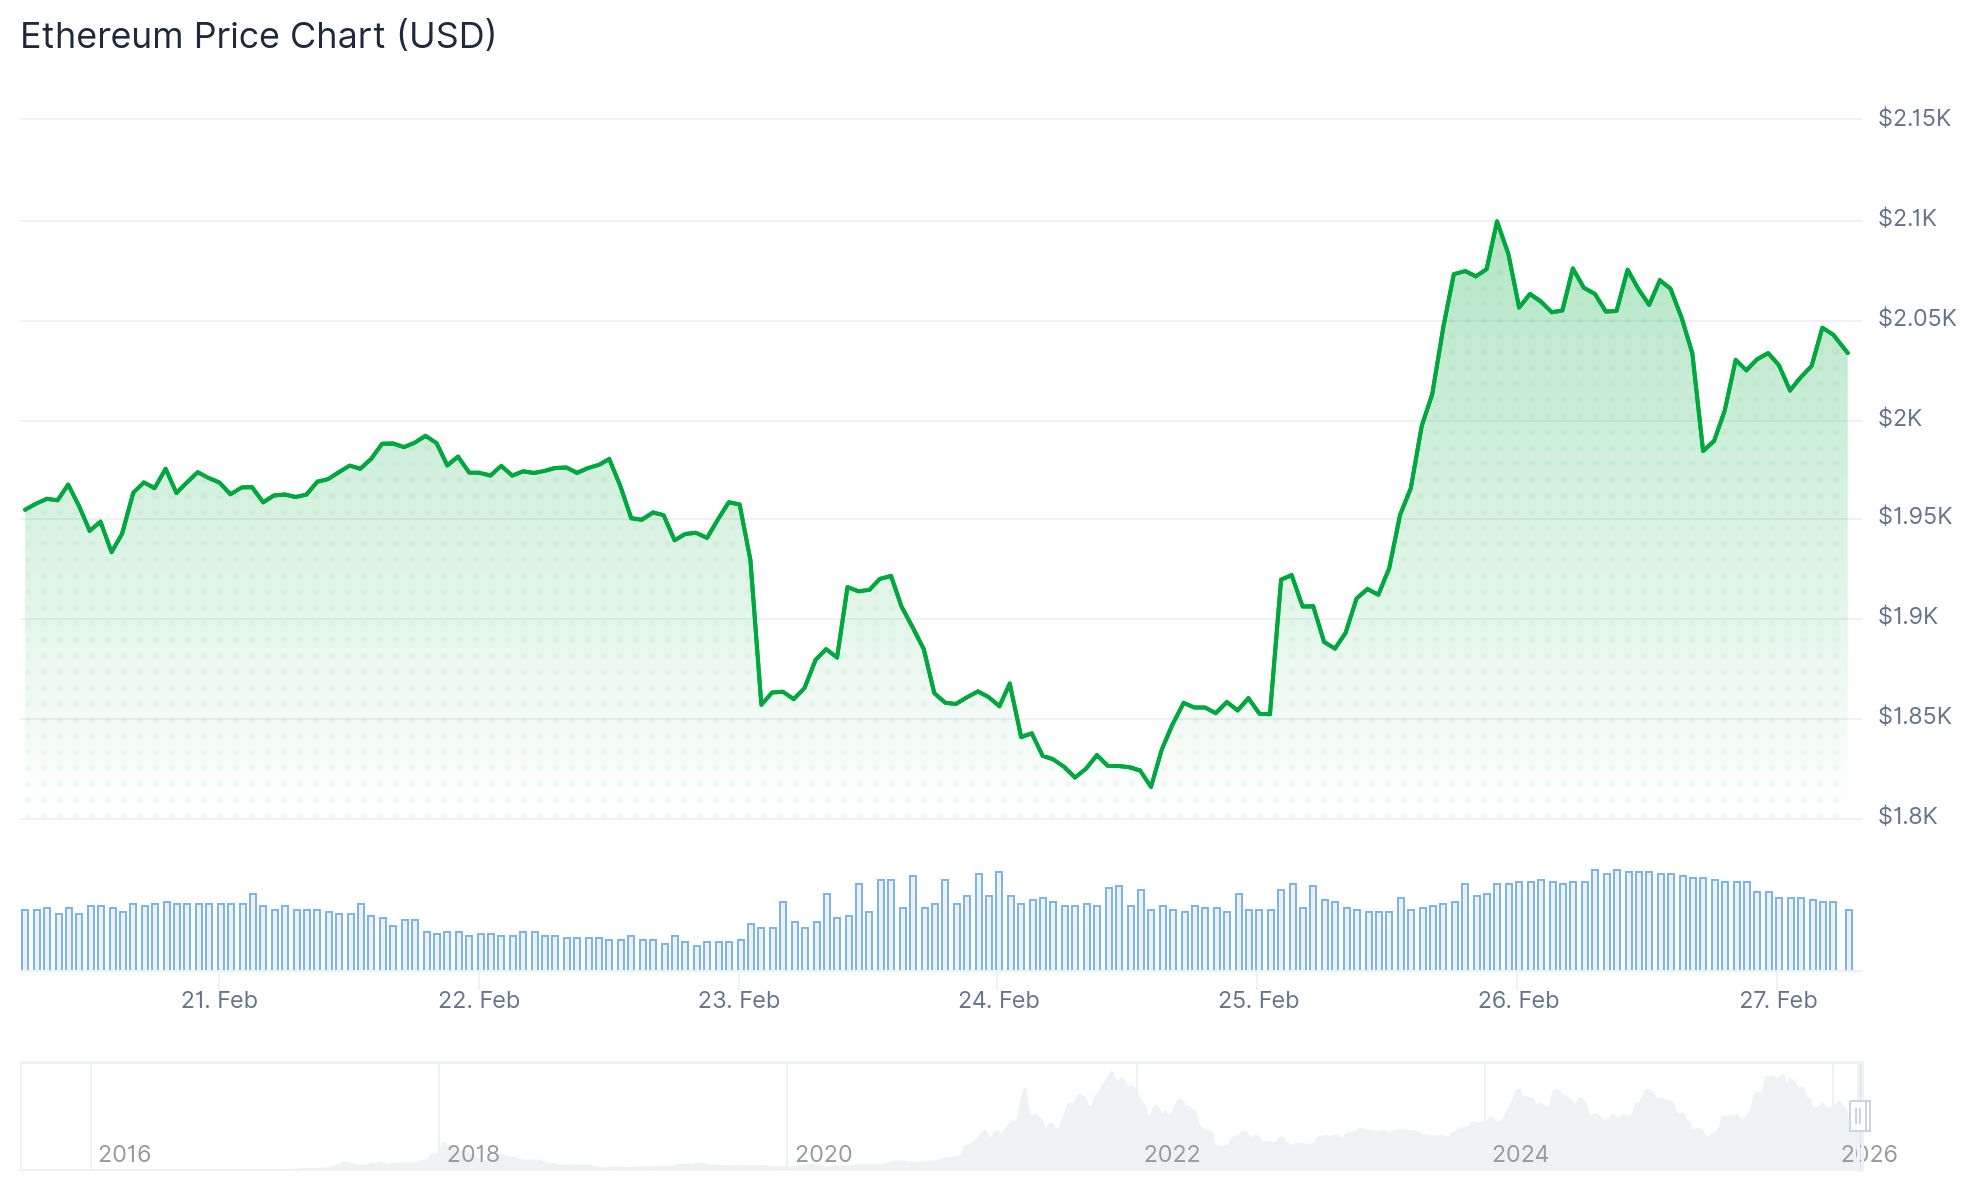
Ethereum pushed toward a weekly peak of $2,150 on Thursday before experiencing a retracement. Price action has consolidated within a narrow band, with $2,000 providing crucial support while $2,100 presents the immediate challenge.
Securing a daily close above $2,100 carries significance as this threshold corresponds to the realized price for whale wallets holding 100,000 ETH or more. The realized price metric reflects the average acquisition cost based on when coins last moved on-chain, offering insight into whether major holders face profits or losses.
Historically since 2020, ETH has rarely dipped beneath this whale cohort’s cost basis, with the most notable exception occurring throughout the 2022 bear cycle. Previous tests of this threshold have typically preceded price recoveries.
Futures and Funding Rates
Liquidations exceeding $220 million on short positions materialized during the previous two days, eliminating substantial overleveraged positions. Binance funding rates, which plunged into deeply negative territory earlier this month as bearish bets accumulated, have now reversed to positive 0.23%.
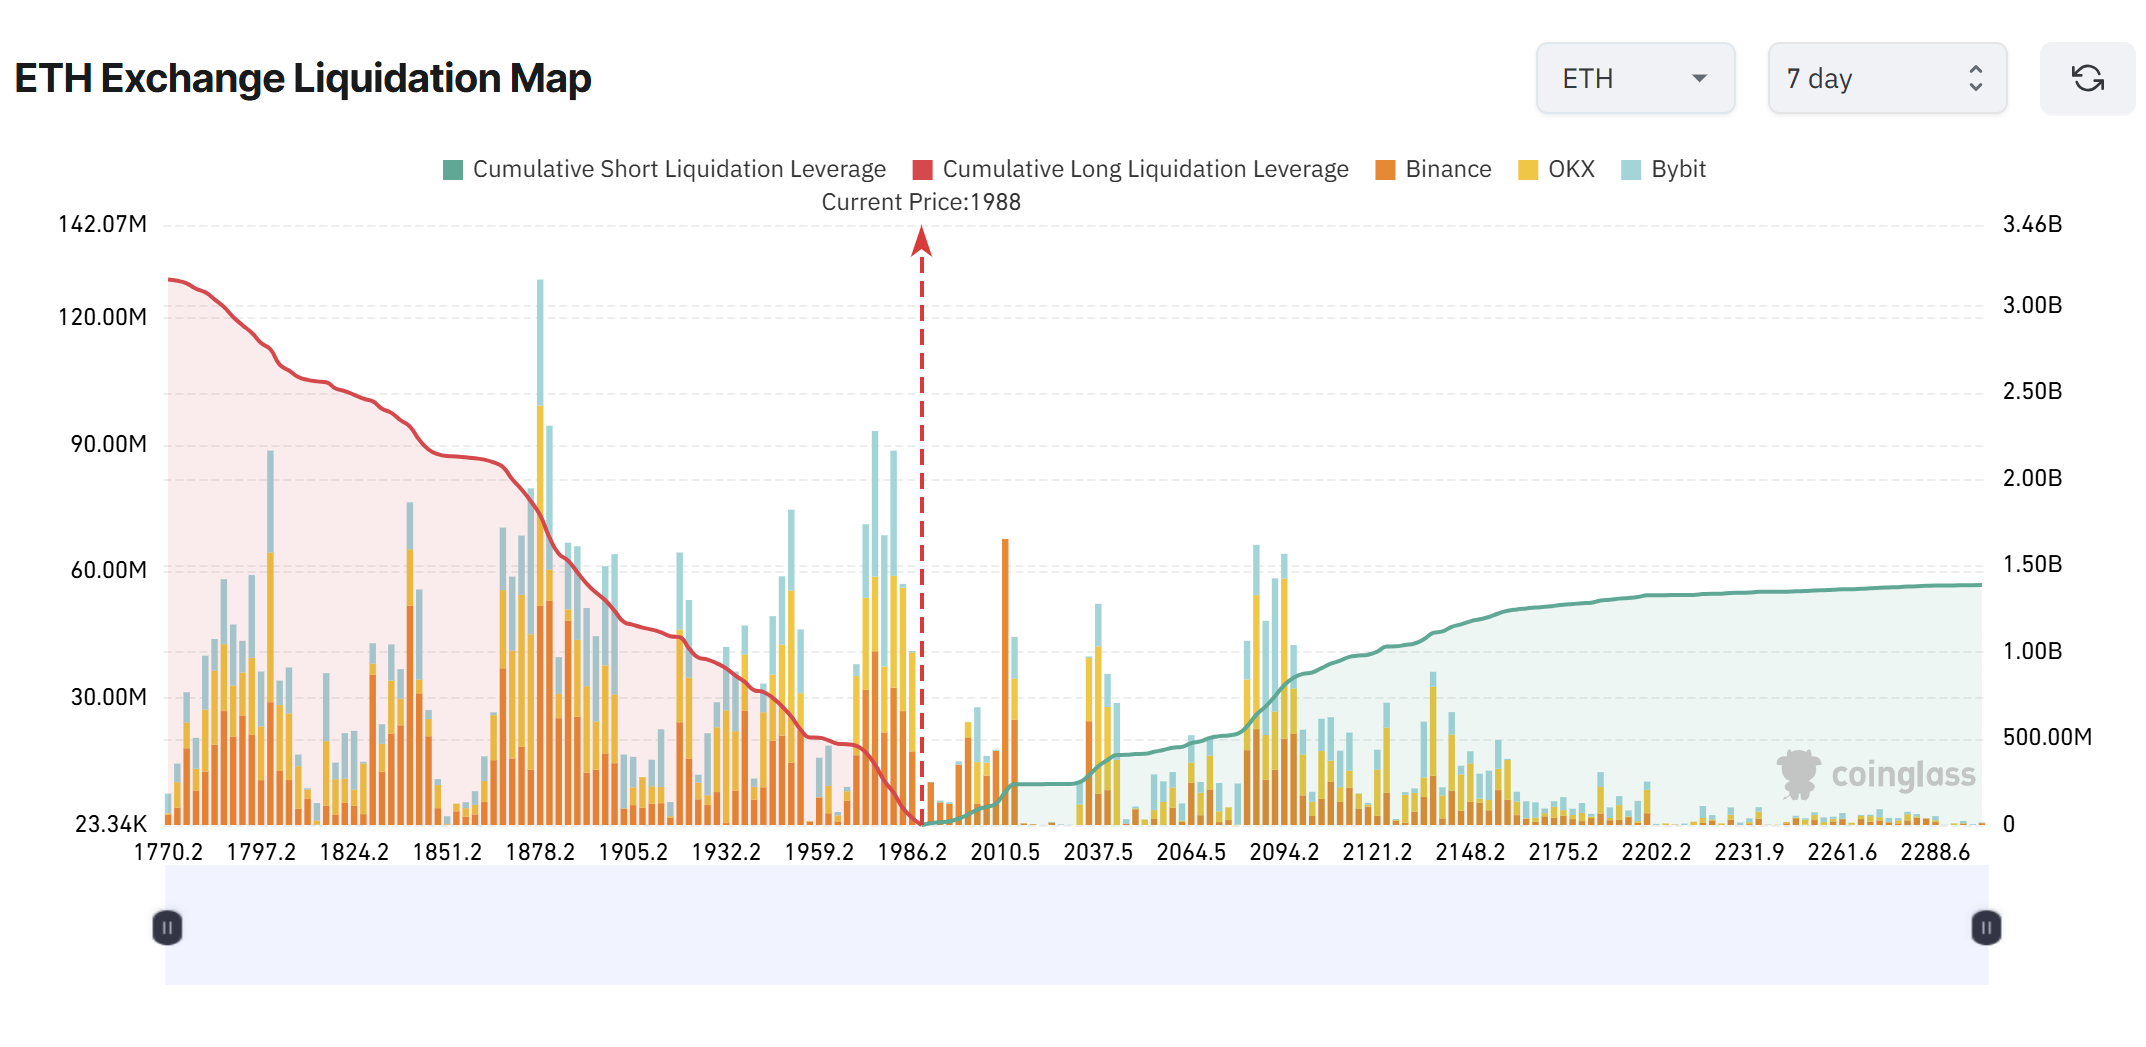
This reversal indicates that late-entry short traders were forced to cover positions. Nevertheless, with funding rates now elevated on the positive side, market positioning leans toward longs, increasing vulnerability to a potential long squeeze near $1,800 should bullish momentum falter.
Approximately $2.66 billion in long liquidation exposure clusters around the $1,800 mark, creating a substantial liquidity pool beneath current trading levels.
Volatility and ETF Flows
Ethereum’s 30-day realized volatility measured on Binance has climbed to approximately 0.97, representing the most extreme reading since March 2025. Heightened volatility during this phase often indicates market indecision rather than establishing a clear directional trend.
The asset continues trading beneath its 50-, 100-, and 200-day moving averages. Every recovery attempt following the rejection near $4,800 in late 2025 has generated progressively lower peaks, a formation suggesting persistent distribution pressure.
Regarding ETF developments, selling momentum has diminished considerably. Following substantial outflows throughout mid-2025, recent flow data indicates smaller magnitude moves in either direction. Institutional distribution appears to be moderating, though definitive accumulation signals remain absent.
Market analyst Leon Waidmann observed that weaker market participants have predominantly exited positions. Short interest continues declining, while high-leverage long positions haven’t rapidly increased to fill the void.
Technical strategist IncomeSharks identified three key resistance zones, including repeated SuperTrend rejections and channel resistance approaching $2,250. The analyst additionally highlighted April lows around $1,500 as a critical level should demand weaken once more.
ETH was trading at $2,034 at time of writing.