
 Hits $2,200 Resistance as SuperTrend Flashes First Bullish Signal Since May 2024")
Key Takeaways
- Ethereum surged 9% during Monday’s trading session but encountered strong resistance at the $2,200 price level
- The 50-day exponential moving average at $2,200 presents overhead resistance, while the 50-day simple moving average at $2,000 provides downside support
- Institutional sentiment remains weak as spot Ethereum ETFs recorded more than $27.5 million in net outflows during the week concluding March 20
- Technical analysis suggests a successful breach of $2,200 could propel ETH toward $3,080, based on symmetrical triangle pattern projections
- For the first time since May of last year, the SuperTrend indicator has shifted to bullish on the daily timeframe
Ethereum’s recent upward momentum encountered significant resistance at the $2,200 threshold on Monday, despite a key technical indicator displaying its first positive signal in approximately ten months.
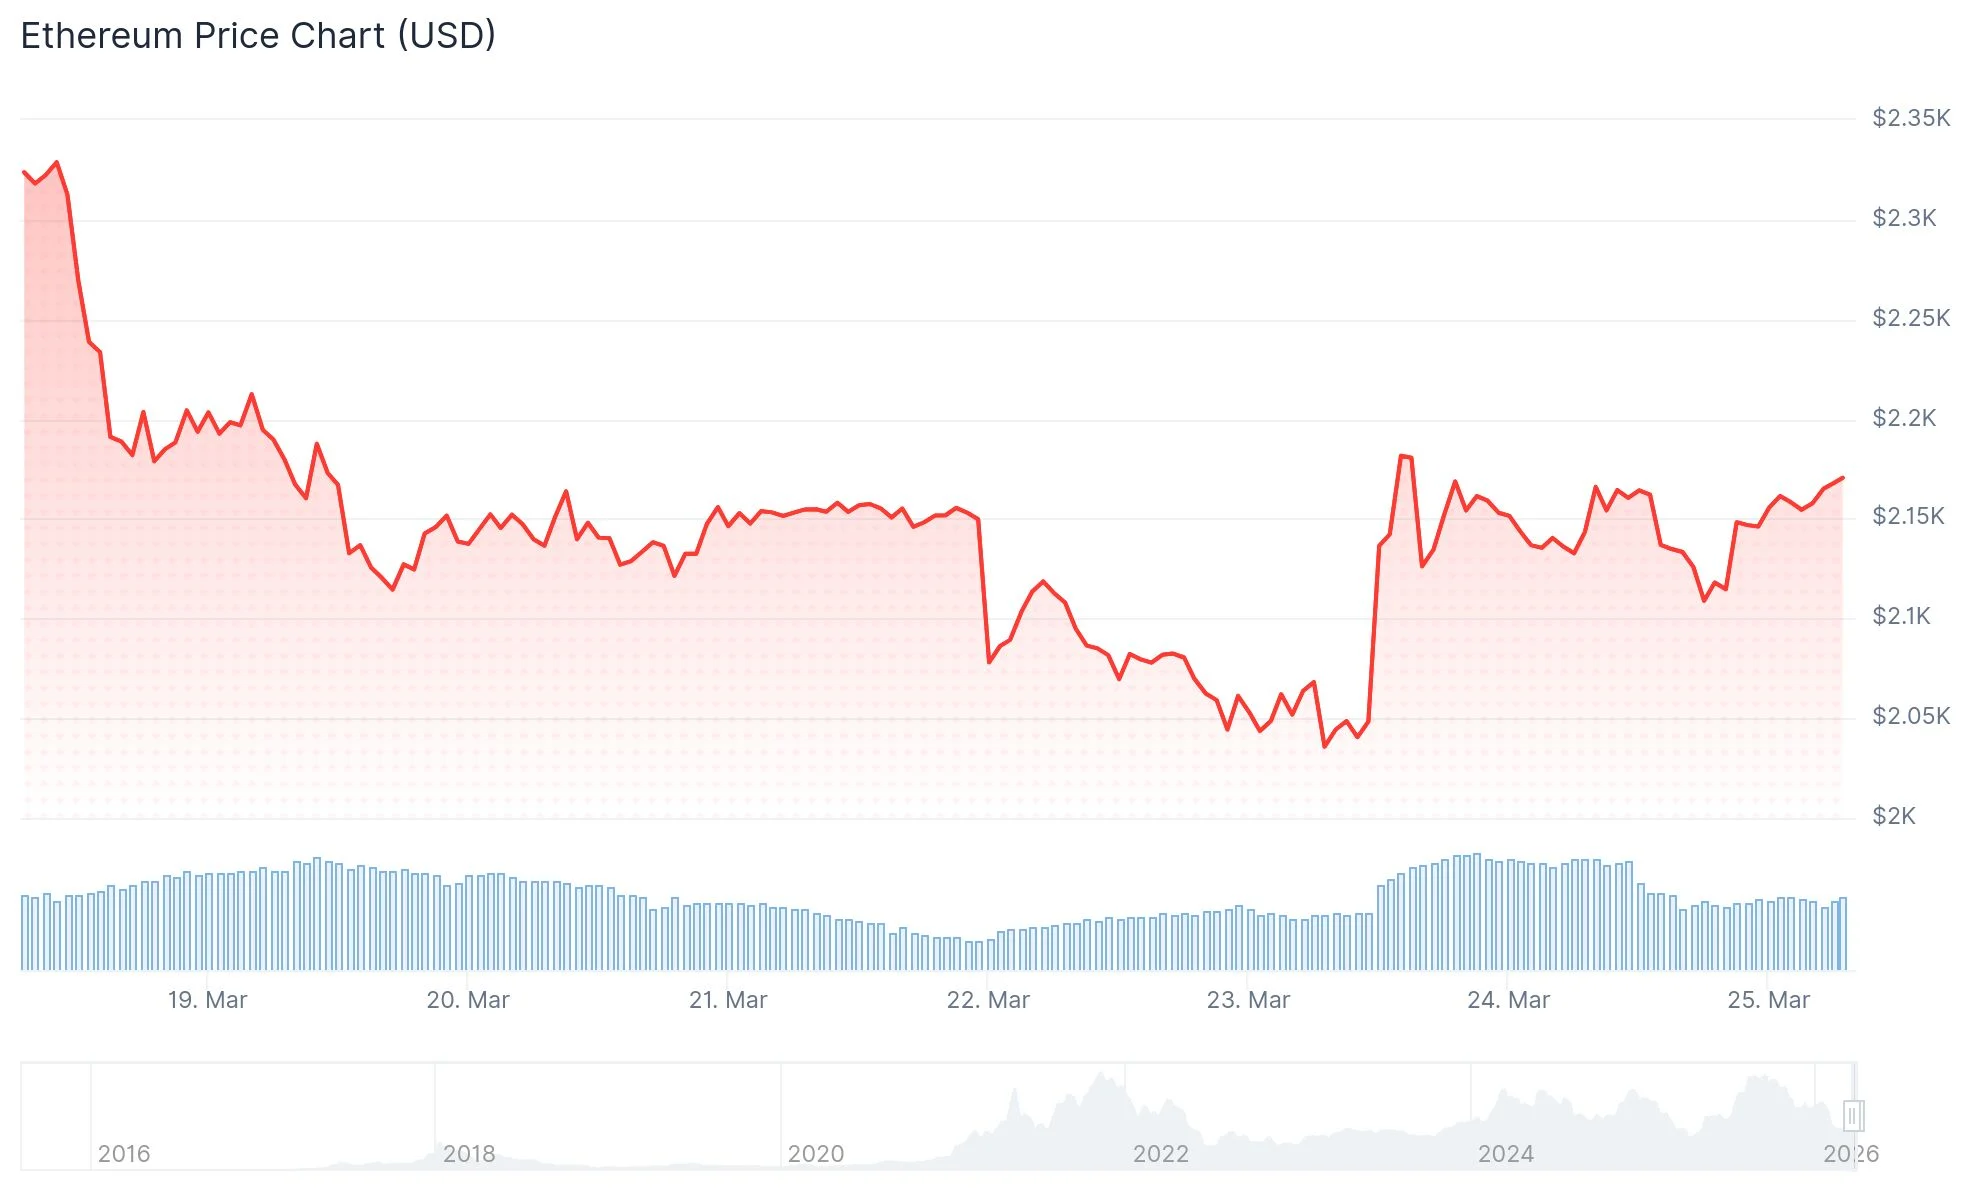
The second-largest cryptocurrency by market capitalization posted approximately 9% gains on Monday but failed to sustain momentum beyond the $2,200 mark. This price point coincides with the 50-day exponential moving average (EMA), which continues to serve as a formidable barrier for bulls.
Presently, ETH is exchanging hands above $2,120, maintaining its position above the 100-hourly simple moving average. The asset has successfully breached a near-term descending trend line that previously capped price action at $2,145 on the hourly timeframe.
Critical Resistance and Support Zones
Traders should monitor the immediate resistance levels at $2,180 and $2,200. A successful push beyond these barriers would bring $2,250, $2,300, and $2,345 into focus as subsequent upside targets.
Should Ethereum manage a decisive daily close above $2,200, technical analysis of the symmetrical triangle formation suggests a potential rally toward $3,080, representing approximately 42% upside from present values.
Nevertheless, the path to such gains wouldn’t be straightforward. A significant resistance cluster exists between $2,780 and $2,880, where multiple moving averages intersect—specifically the 200-day EMA, 50-week EMA, and 100-week EMA. According to Glassnode analytics, over 7.5 million ETH was accumulated by market participants within the $2,750–$2,850 price range.
Regarding downside risk, analyst Ted Pillows highlighted in an X platform post: “Now, the only crucial support level for Ethereum is $2,000 and if ETH loses it, the dump will accelerate to new lows.” The bearish triangle pattern projects a target of $1,400 should support collapse.
Institutional Appetite Remains Subdued
A significant challenge confronting ETH involves lackluster institutional participation. After experiencing a temporary period of capital inflows, spot Ethereum ETF flows have reversed to negative territory. The 30-day moving average for US-based spot ETH ETF flows has returned to negative readings.
Global Ethereum investment vehicles experienced over $27.5 million in net redemptions during the week that ended March 20.
Corporate treasury purchases of ETH have declined substantially since August 2025. A notable outlier is Bitmine Immersion Technologies, under Tom Lee’s leadership, which acquired $139 million worth of ETH during the previous week. Bitmine’s holdings now stand at 4.66 million ETH, approaching its announced objective of controlling 5% of the circulating supply.
On a more optimistic note, cryptocurrency analyst Ali Charts shared on X: “Momentum is finally shifting back to the Ethereum $ETH bulls. The SuperTrend on the daily chart has turned green (bullish) for the first time since May last year. This suggests the long period of ‘sideways grind’ is ending, and as long as the $1,800 support holds, a new uptrend could begin.”
Bitmine continues as the sole corporate entity actively expanding its ETH treasury position, with accumulated holdings reaching 4.66 million ETH.