
 Crashes Below $2,000 Amid $392M ETF Exodus")
Key Highlights
- Ethereum plunged beneath $2,000, declining 5% over 24 hours and 6% across the week
- ETH-based ETFs experienced seven straight sessions of withdrawals amounting to $392 million
- Market demand for ETH reached its weakest point since 16 months ago
- Critical support zone established at $1,911, with technical analysts monitoring $1,750 as next significant threshold
- Cryptocurrency holdings on exchanges decreased from 22 million ETH during 2023 to approximately 15 million ETH
Ethereum breached the psychologically important $2,000 threshold on Friday, March 27, 2026. The decline resulted in more than $111 million worth of leveraged long positions being forcibly closed within 24 hours, based on information from Coinglass.
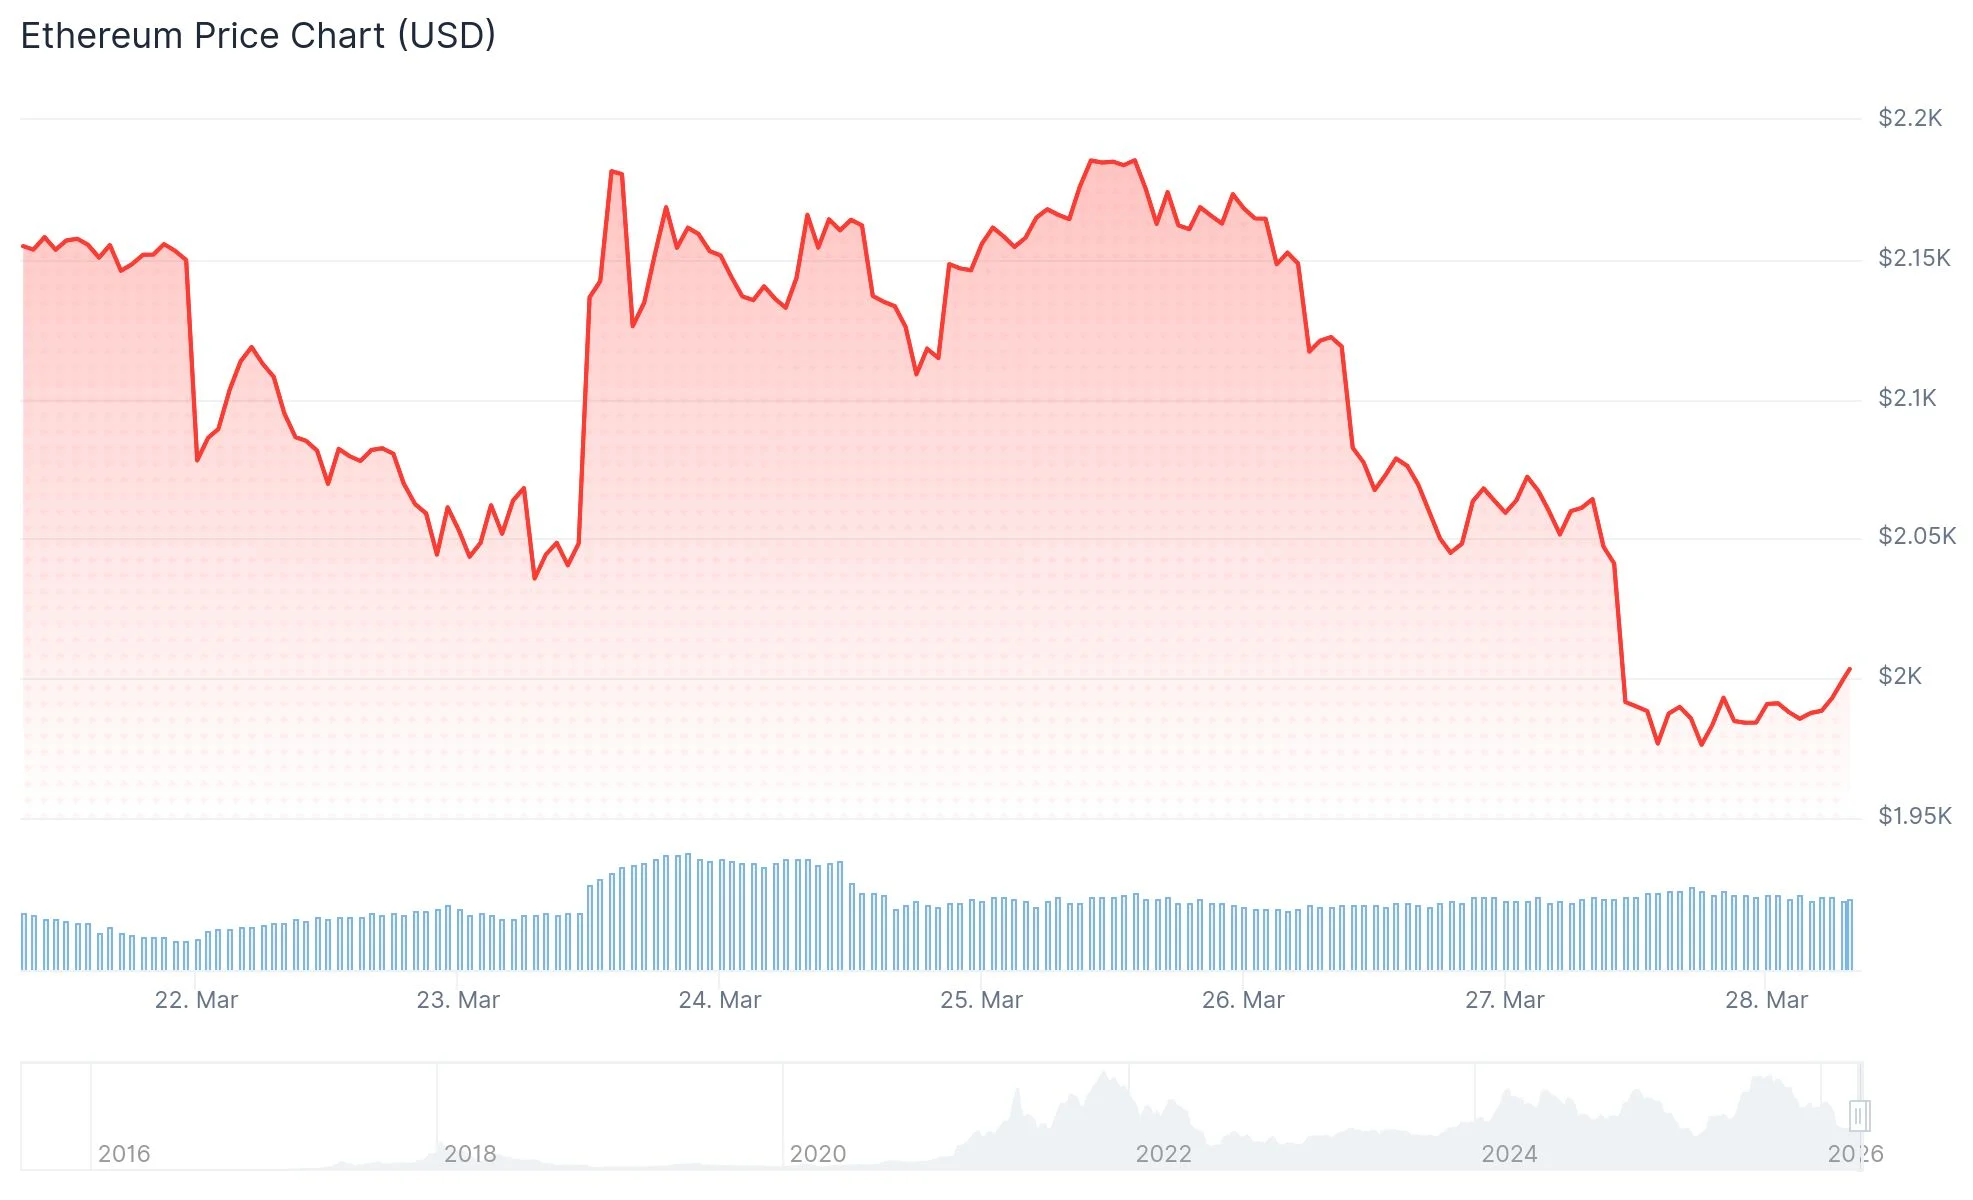
This downward movement expanded ETH’s seven-day losses to 6%, sending monthly performance figures into the red.
Global tensions contributed to market uncertainty. Iran’s Islamic Revolutionary Guards Corps delivered threats to personnel working at industrial facilities across Israel and Gulf nations in anticipation of a planned counterattack. These warnings came after coordinated US and Israeli operations targeting Iranian industrial infrastructure, intensifying overall market caution.
Institutional appetite for Ethereum has evaporated rapidly. Exchange-traded funds holding spot ETH experienced an unbroken streak of seven consecutive days with net redemptions, accumulating approximately $392 million in total outflows. This institutional withdrawal, previously a crucial catalyst for price appreciation, has ground to a halt.
Market analyst Ted Pillows highlighted on X that ETH ETF redemptions hit $92.5 million within just one trading session, with BlackRock responsible for liquidating $43.2 million worth of Ethereum alone.
Individual investor sentiment has similarly weakened. The Coinbase Premium Index declined deeper into negative territory, indicating American traders are either liquidating positions or remaining inactive.
Metrics from Capriole Investments reveal that observable demand for ETH has registered negative readings since the beginning of March, marking a 16-month nadir.
Chart Analysis Suggests Further Downside
Examining the daily timeframe, ETH is positioned beneath its 20-day exponential moving average. The 50-day and 100-day EMAs remain considerably higher at $2,180 and $2,430 respectively, confirming the prevailing trend stays bearish.
Technical analyst CryptoWZRD highlighted that a daily close underneath $2,200 earlier this week served as an initial alert preceding “additional downside movement.” With both $2,100 and $2,000 now decisively breached, the subsequent important area lies between $1,750–$1,850.
Analyst CyrilXBT published a technical chart illustrating ETH trading significantly below its 200-day EMA positioned near $2,766. He cautioned that penetration below the $1,750 support could drive ETH toward the $1,400–$1,500 range.
On-Chain Metrics Reveal Alternative Narrative
One divergent indicator involves exchange balances. Based on CryptoQuant analytics shared by researcher James Easton, Ethereum stored on centralized exchanges has contracted from exceeding 22 million during 2023 to roughly 15 million ETH currently. Easton characterized whale behavior as “accumulating and staking.”
Nevertheless, diminishing exchange inventories independently don’t guarantee imminent price appreciation. While the metrics demonstrate tokens withdrawing from trading platforms, they don’t conclusively validate accumulation strategies.
Regarding institutional accumulation, BitMine Immersion-associated wallets acquired 117,111 ETH across a three-day window, according to Lookonchain monitoring. The organization had earlier verified purchasing 65,341 ETH.
ETH open interest climbed to 14.72 million ETH, despite funding rates shifting into negative territory.
Near-term support rests at $1,911, with secondary support positioned at $1,741. A decisive breakdown beneath $1,741 would validate continuation of the existing bearish trajectory.