
 Price Pattern Mirrors Historic Rallies That Delivered 5,800% and 21,000% Returns")
TLDR
- Dogecoin currently trades near $0.09106, positioned in what historical data suggests is a consolidation and correction period similar to previous cycles.
- Analyst Bitcoinsensus reveals Cycle 3 displays structural similarities to Cycles 1 and 2, which produced returns of 5,800% and 21,000% respectively.
- Historical bottom formation shows progression — Cycle 1 found support near $0.000020, Cycle 2 bottomed around $0.00070, while Cycle 3 maintains support above $0.09.
- Current Binance futures data indicates traders are expanding long exposure, with both account ratios and volume metrics favoring bullish positioning.
- Institutional DOGE ETF activity shows zero momentum with daily net inflows at zero and total net assets hovering around $9.12 million.
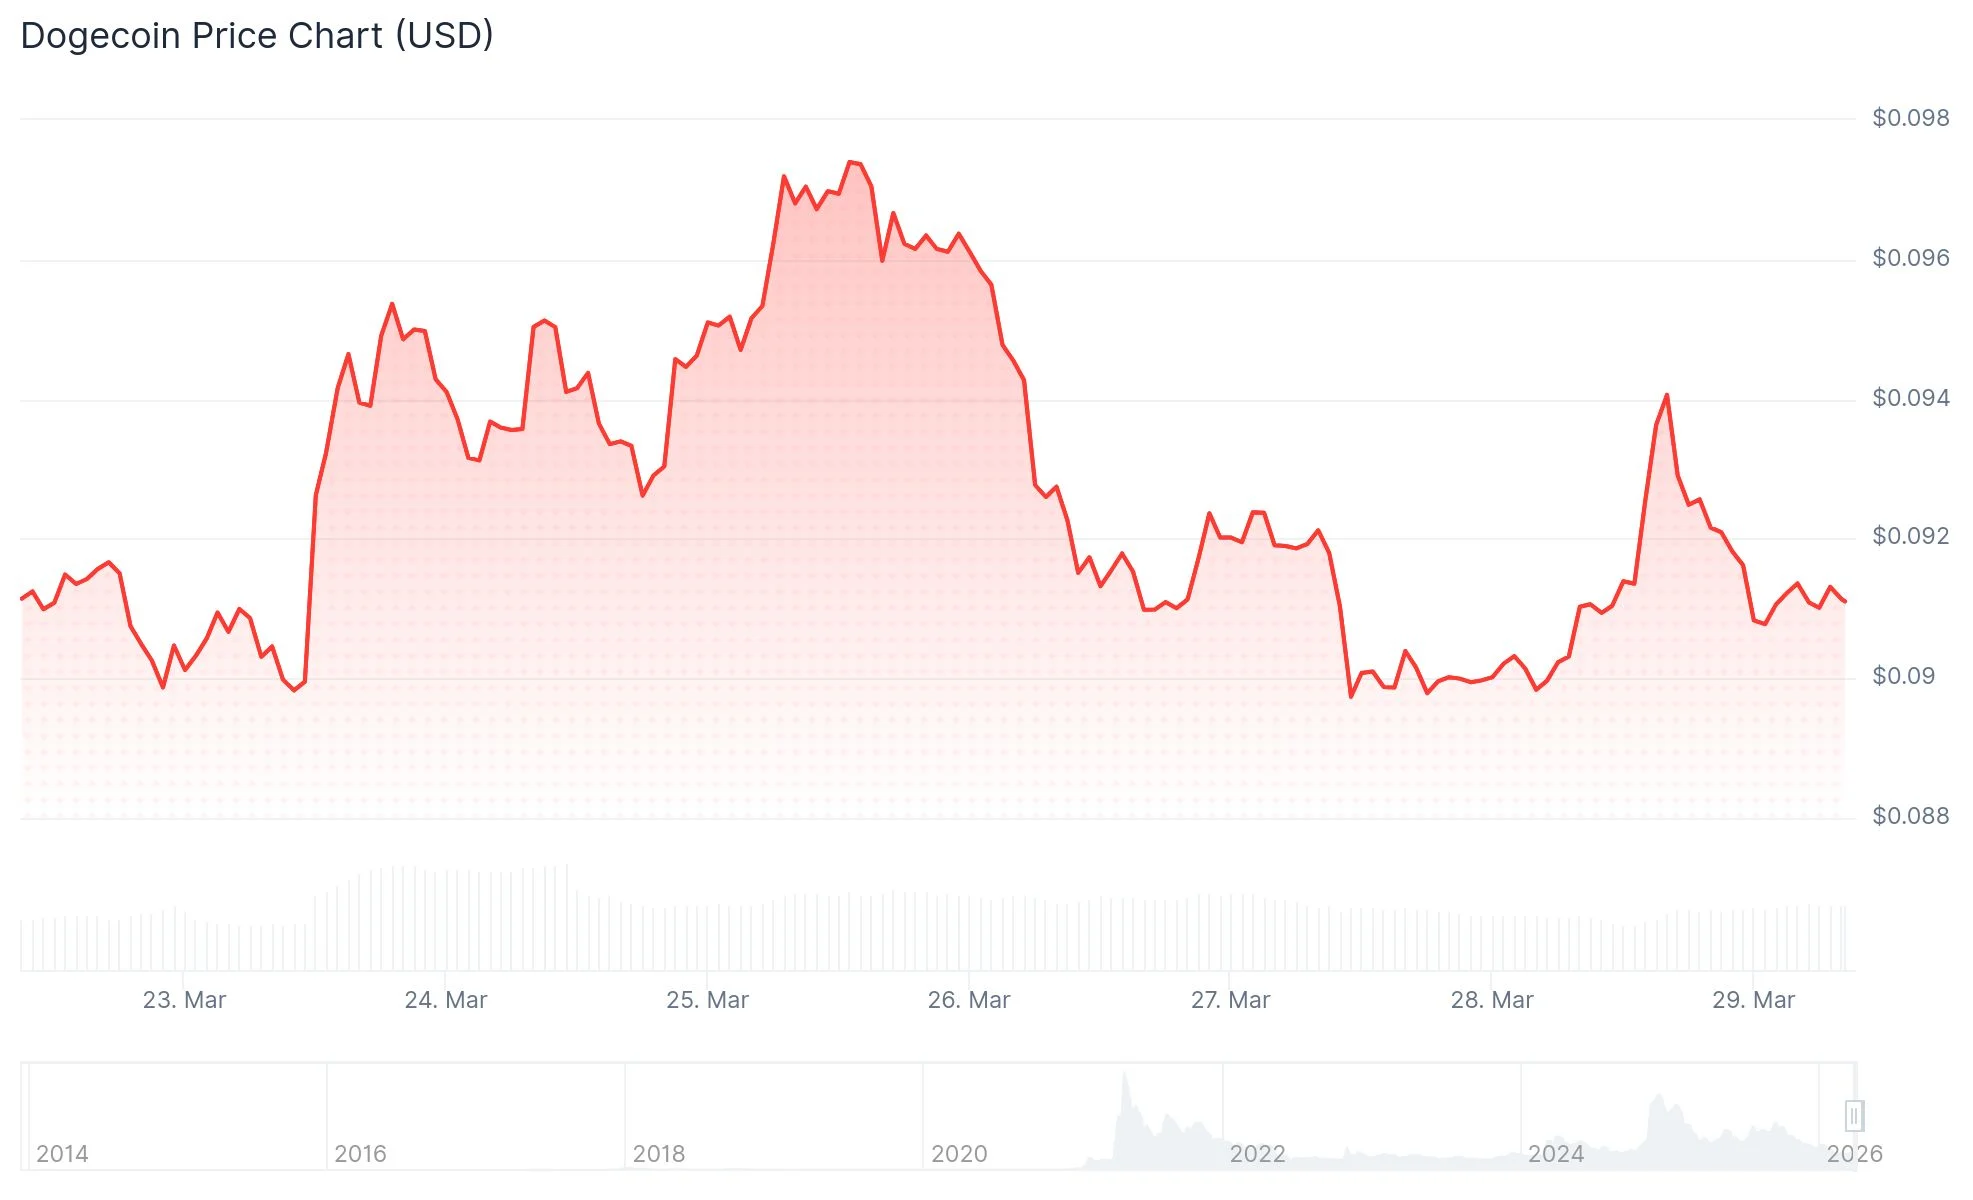
Dogecoin (DOGE) is currently hovering around the $0.09106 mark. The prominent meme cryptocurrency has captured market attention following viral circulation of a technical analysis chart from crypto analyst Bitcoinsensus, which places three distinct DOGE market cycles in direct comparison.
The first cycle delivered staggering returns exceeding 5,800%. The second cycle surpassed expectations with gains climbing beyond 21,000%. Both cycles displayed remarkably similar characteristics: gradual accumulation, explosive upward movement, followed by significant retracement. The current Cycle 3 demonstrates structural alignment with these historical precedents.
DOGE touched a cyclical high approaching $0.70 before entering correction territory. The asset has since retreated and is currently establishing range support between $0.09 and $0.10.
A particularly noteworthy observation across all three market cycles is the progressive elevation of each correction bottom. The first cycle established its floor near $0.000020. The second cycle formed support around $0.00070. The third cycle has maintained support above $0.09 throughout its current pullback phase.
This ascending floor pattern indicates accumulation activity at progressively higher price thresholds with each successive cycle. The trend suggests expanding market participation and a broadening investor base over time.
Binance Futures Data Reveals Growing Bullish Sentiment
Current Binance exchange metrics reveal a notable shift in trader positioning dynamics. The long-to-short ratio among experienced traders has been climbing consistently, measured both by participant count and capital allocation. This indicates an increasing number of market participants are establishing upward price expectations, with many expanding position sizes rather than taking profits.
This positioning structure typically signals building market conviction, though it simultaneously introduces crowding risk. When trader sentiment becomes excessively one-directional, markets often experience sharp corrective movements.
Nevertheless, current accumulation behavior demonstrates active buying at present price levels rather than reactive positioning following momentum moves.
Technical Indicators Suggest Compression Before Significant Movement
Examining key technical metrics, the Relative Strength Index registers near 42 — positioned in neutral territory without extreme conditions. The MACD histogram shows minimal divergence. The Average Directional Index reads approximately 15, confirming absent directional momentum in the current environment.
Bollinger Bands display significant compression, with overhead resistance established near $0.10 and downside support anchored near $0.09. Historical precedent suggests tight band compression frequently precedes volatility expansion.
A decisive break above $0.10 resistance could establish trajectory toward $0.15 targets. Conversely, failure to maintain $0.09 support would likely trigger additional downside price discovery.
Regarding exchange-traded fund activity, daily net capital flows remain at zero. Total fund assets under management sit around $9.12 million without measurable expansion. Institutional capital deployment through these investment vehicles has shown no significant activity.
Market analyst Vuori Trading published commentary on X platform describing DOGE‘s current price zone as a “generational buying zone,” projecting potential for the asset to “hit $10+ this cycle.”
ETF capital flows continue showing zero daily net movement, with aggregate net assets remaining stable near $9.12 million.