
 Forms Critical Falling Wedge Pattern Amid Trader Speculation")
Key Takeaways
- A falling wedge formation is developing on DOGE’s daily chart, a pattern often associated with significant price breakouts.
- Immediate overhead resistance lies between $0.105 and $0.11, coinciding with critical Fibonacci retracement zones.
- RSI indicators show recovery from oversold conditions and are nearing neutral territory with slight bullish momentum.
- The 50-day EMA presents a significant obstacle above current levels, and breaking through it could signal a genuine trend reversal.
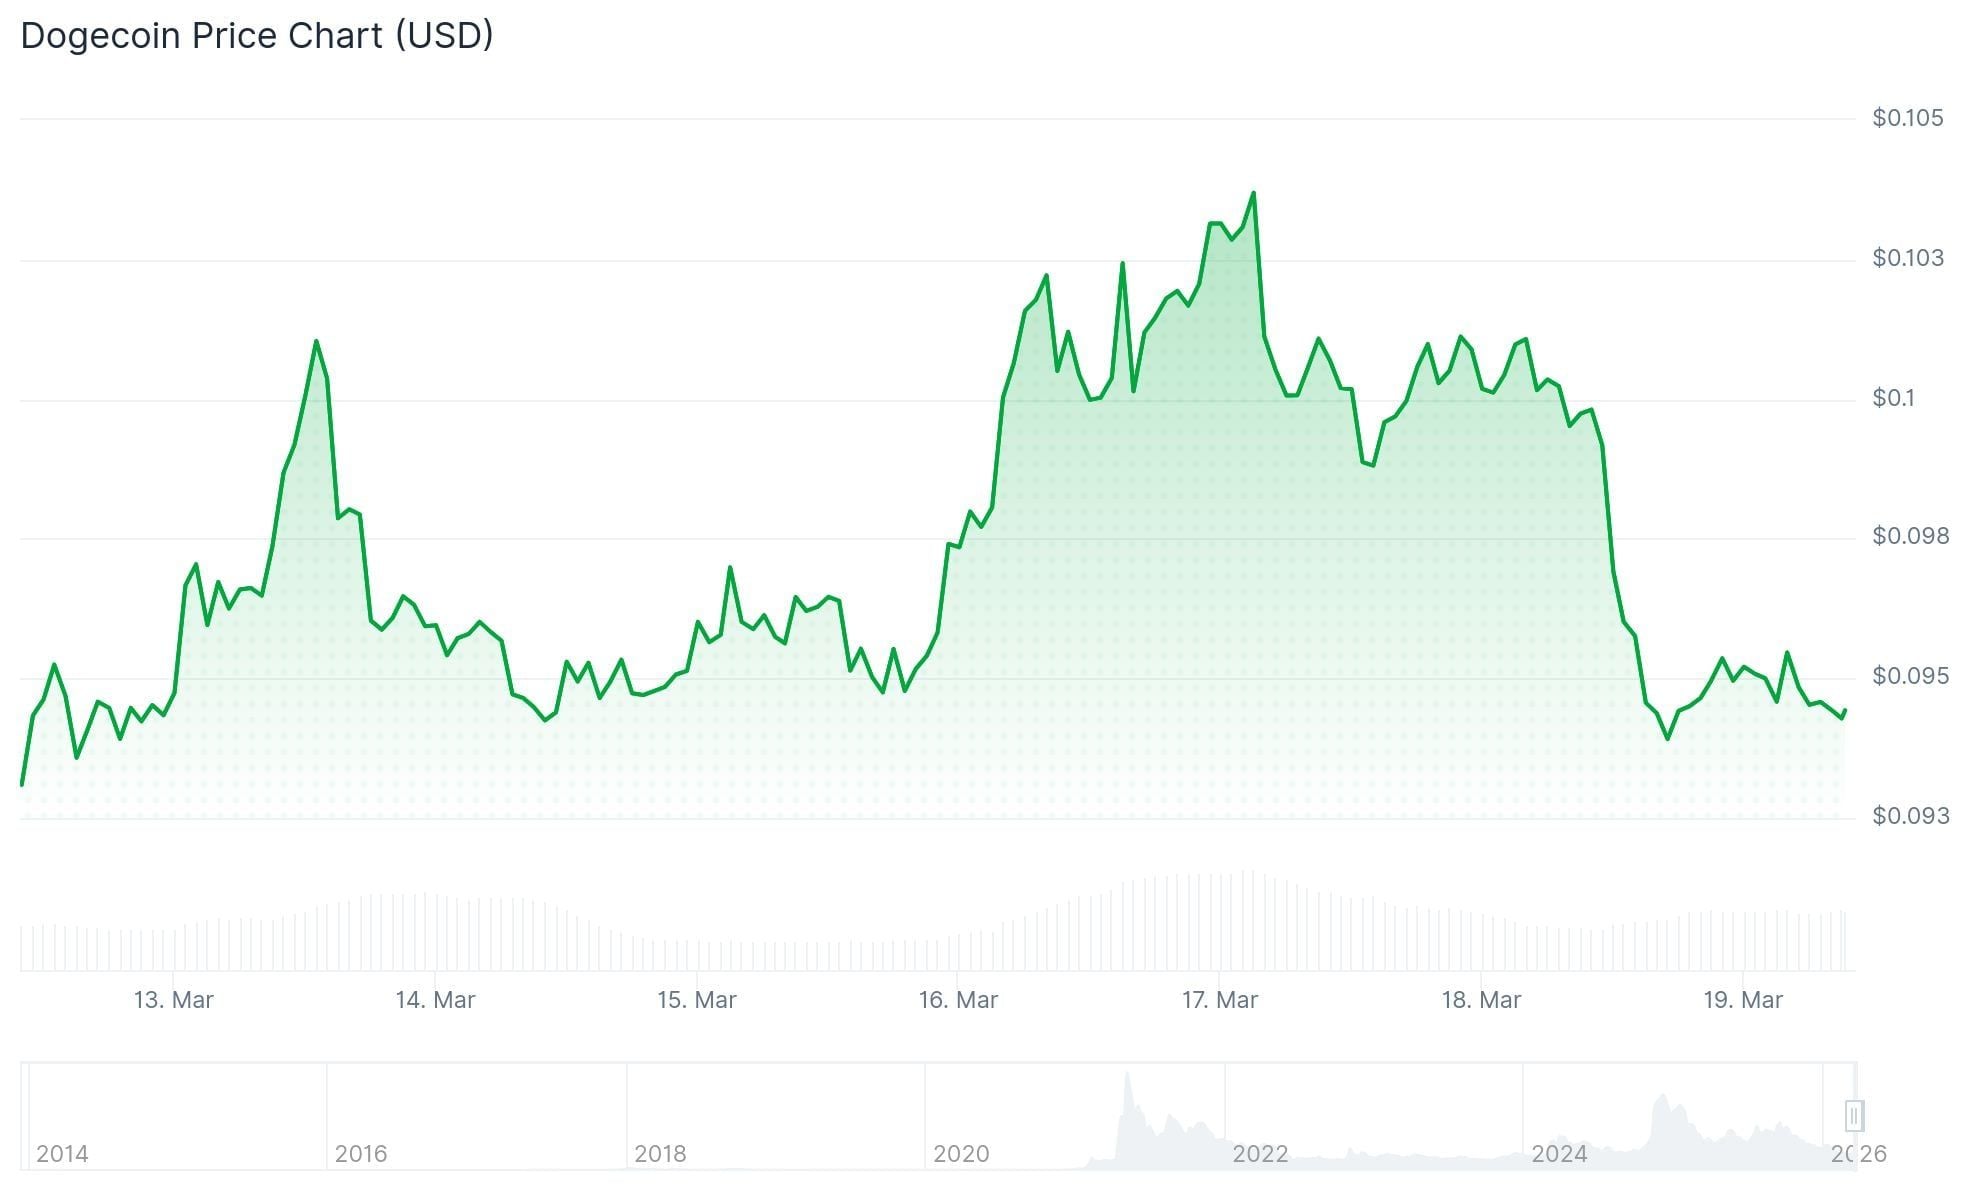
- As of March 18, DOGE was changing hands around $0.094, reflecting a nearly 5% decline over 24 hours.
Dogecoin continues to consolidate around the $0.10 mark, forming a tightening pattern that has captured market participants’ attention. While historical precedents suggest potential significant movements ahead, the immediate outlook remains uncertain.
Technical analysts have identified a falling wedge structure on DOGE’s daily timeframe. This configuration emerges when an asset creates successively lower peaks while the troughs gradually converge. As the price range narrows, a breakout typically occurs. Long-term holders anticipate this breakout will be to the upside.
This consolidation phase emerged following a correction period that came after substantial earlier rallies. Throughout this timeframe, Dogecoin has exhibited declining peaks alongside diminishing selling pressure, indicating potential exhaustion among bears.
Immediate Resistance Zone Creates Barrier
The primary obstacle for any upward movement exists within the $0.105 to $0.11 range. This region aligns with the 0.5 to 0.618 Fibonacci retracement measurements derived from the recent decline. Additionally, it intersects with clustered short-term exponential moving averages, creating a substantial resistance barrier.
DOGE has approached the $0.10 threshold on numerous occasions throughout the past twelve months. During each instance when it breached this level, selling pressure returned and forced prices lower. Technical analysts note this recurring pattern has diminished $0.10’s reliability as a dependable support foundation.
A decisive breakthrough above $0.11 would create pathways toward $0.116 and subsequently $0.136. However, until this occurs, the cryptocurrency remains positioned beneath its 50-, 100-, and 200-day moving averages, maintaining the prevailing bearish structure.
On March 18, DOGE was exchanging hands near $0.094, representing a 4.84% daily decrease.
50-Day EMA Presents Major Challenge
Even should DOGE successfully breach $0.11, the 50-day EMA hovers directly overhead and has continuously tracked the downward trajectory since the correction commenced. This moving average dynamically adjusts with price action, complicating efforts to maintain a sustained breakout above it.
Previous cycles demonstrate that recapturing the 50 EMA has typically served as the initial legitimate indication of a shifting trend for DOGE. Absent this validation, market analysts view any advance beyond $0.10 as temporary relief rather than genuine reversal.
The RSI has climbed from oversold territory and currently sits near the neutral midpoint with modest bullish characteristics. The MACD indicator is likewise nearing a possible bullish crossover, implying that downward momentum is weakening.
Current market data indicates DOGE maintains position above its extended-term support foundation at $0.086, which marked the most recent local bottom before the present recovery attempt.