

Contents
TLDR
- Bitcoin hovers around $62,900, posting a 7.5% weekly decline and remaining confined within the $60K–$70K trading corridor
- Major altcoins including ETH, XRP, SOL, and DOGE experienced declines ranging from 8% to 11% amid intense selling pressure
- Concerns over AI’s disruptive potential are driving capital away from both technology equities and cryptocurrency markets
- Major US indices including the Dow, S&P 500, and Nasdaq declined more than 1% Monday, though futures showed modest recovery Tuesday
- Technical analysts identify a bearish pennant pattern in Bitcoin’s chart, with $70K representing a critical resistance level
Bitcoin’s price retreated to $62,900 on Tuesday, continuing a prolonged downward drift that has characterized most of February’s trading activity. The leading cryptocurrency has declined 2.1% in the past 24 hours and 7.5% over the weekly period.
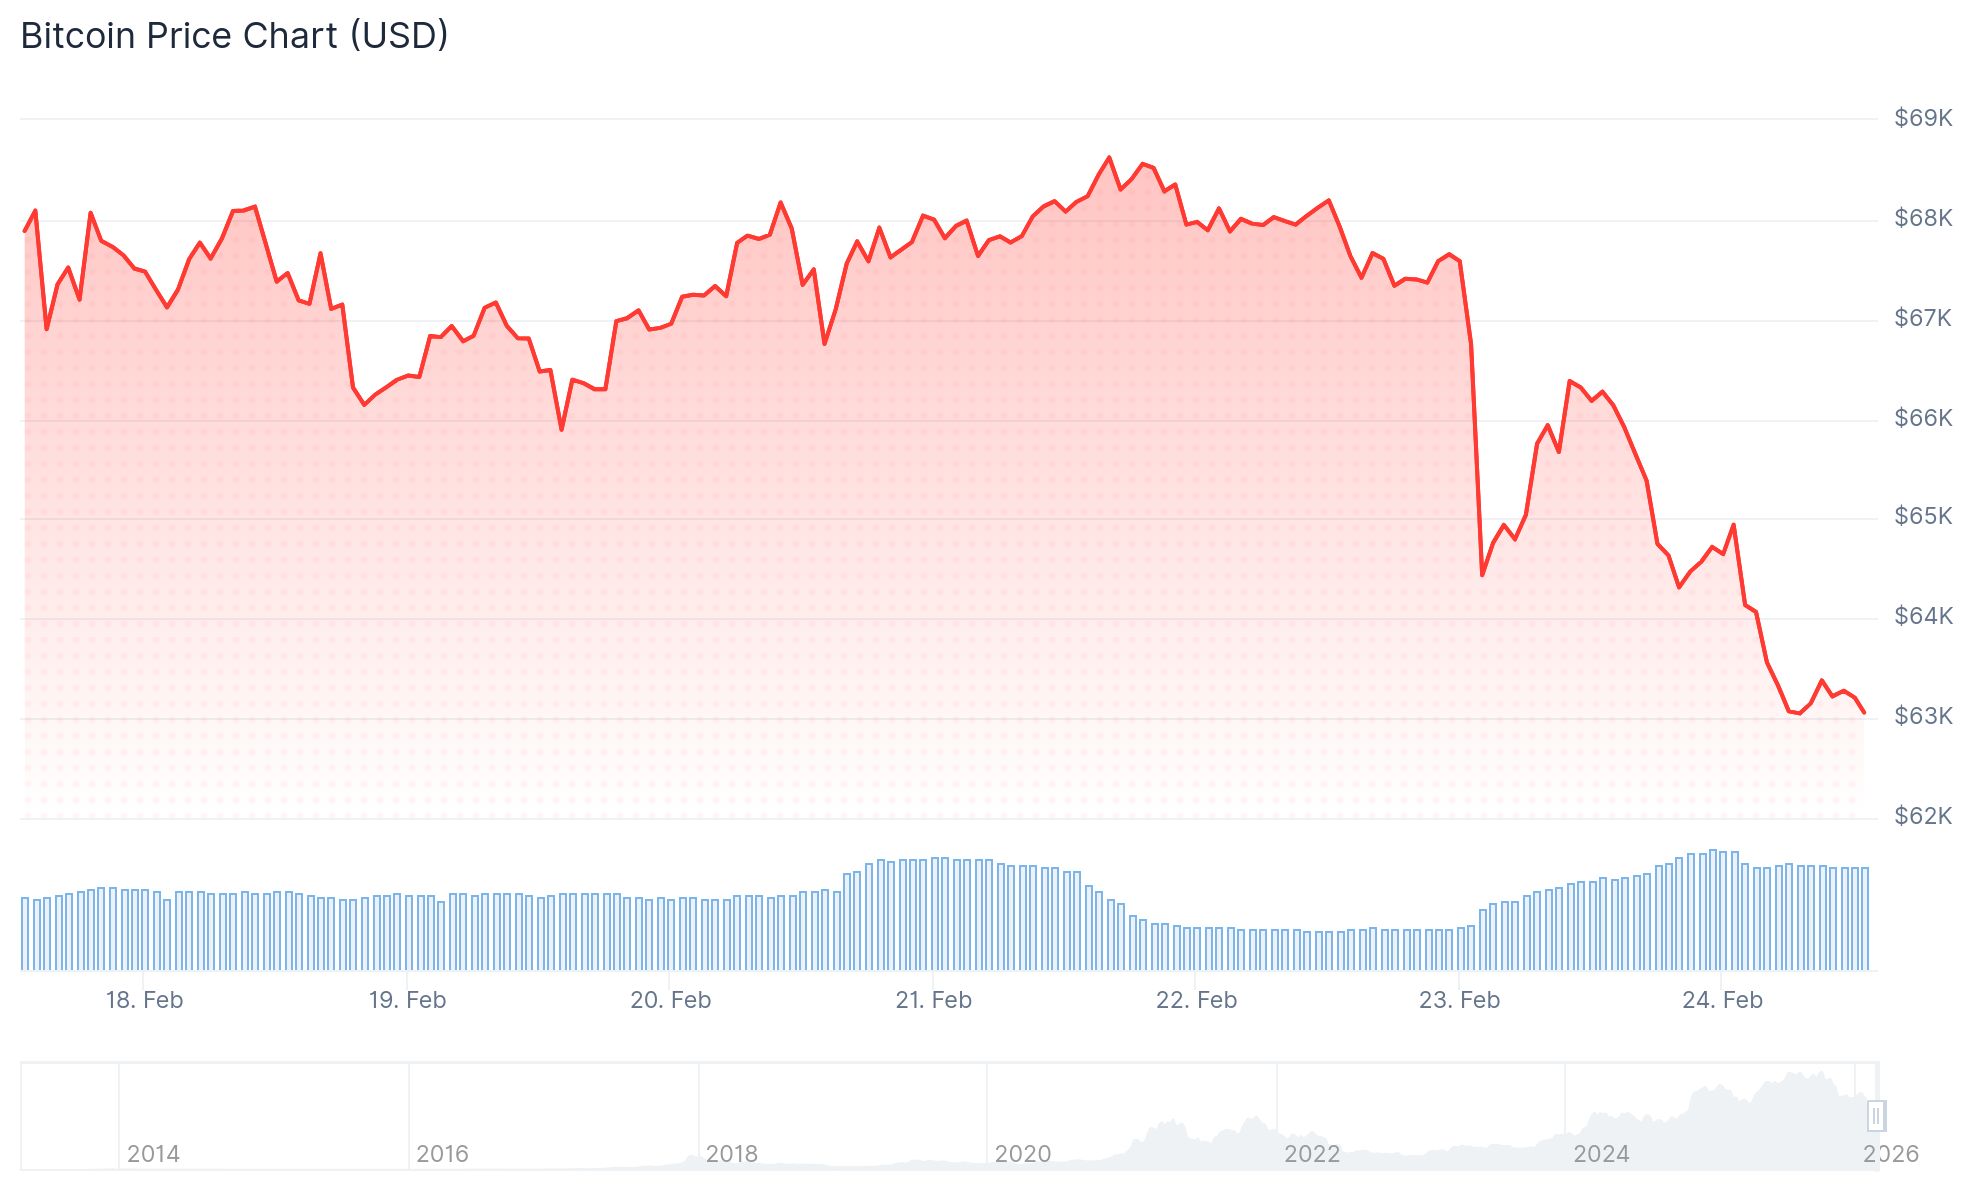
Since the market correction on February 5, the digital asset has remained confined within a $60,000 to $70,000 trading band. Market observers note that this extended consolidation is beginning to resemble a holding pattern rather than a foundation for recovery.
Alternative cryptocurrencies are experiencing more severe price declines compared to bitcoin. Ethereum has retreated to $1,829, marking an 8% weekly loss. XRP has declined 10.8%, Solana has fallen 11.3%, and Dogecoin has dropped nearly 10%.
Blockchain analytics platform CryptoQuant has documented that altcoin selling pressure has climbed to levels not witnessed in five years. Token holders are liquidating positions into a market characterized by limited buyer interest beyond the most established cryptocurrencies.
This type of sustained selling activity doesn’t produce the dramatic price collapses that typically attract bargain hunters. Instead, it generates a gradual erosion that proves challenging for traders to navigate effectively.
What the Charts Are Saying
Alex Kuptsikevich, chief market analyst at FxPro, characterized bitcoin’s recent movement as consolidation rather than a bullish recovery pattern. His technical analysis reveals a bearish pennant formation developing on the daily timeframe.
A breakdown beneath the mid-$65,000 zone would validate expectations for additional downside movement. Conversely, a breakout above $70,000 would invalidate the bearish technical configuration.
Bitcoin currently trades 48% below its record high and sits 5.5% beneath its 2021 peak of $69,000. The extended duration within this range without an upward breakthrough intensifies technical pressure favoring further declines.
The AI Trade Hitting Both Stocks and Crypto
Citrini Research published analysis this week highlighting an emerging “AI scare trade.” Their research cautioned that artificial intelligence technologies pose disruption risks to businesses spanning delivery, payment processing, and software industries.
This assessment triggered sell-offs across technology-oriented stocks. When equity markets shift toward risk-averse positioning, cryptocurrency markets typically experience parallel pressure as both asset classes compete for the same investment capital.
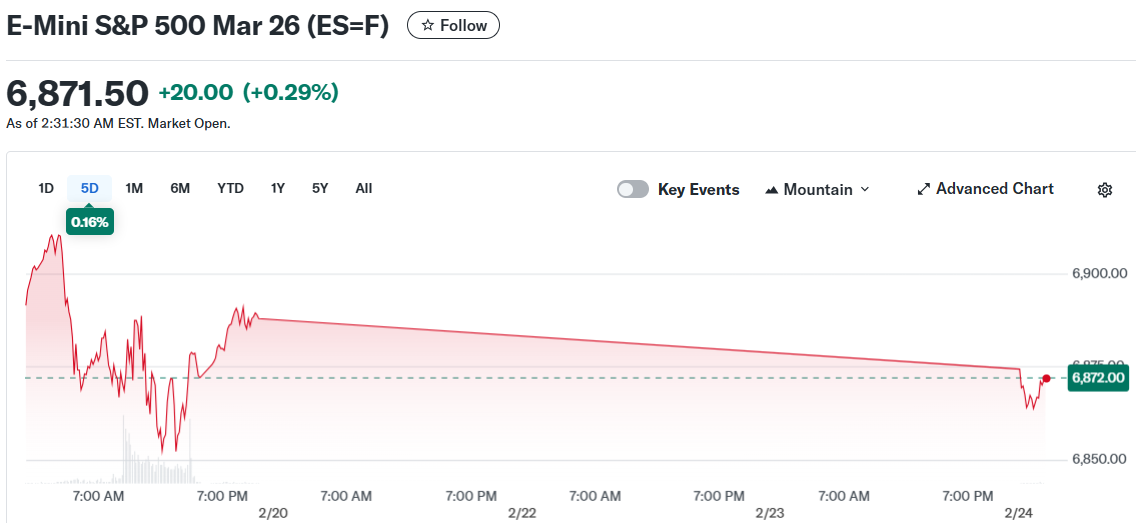
The Dow Jones Industrial Average experienced significant losses Monday, partially driven by IBM’s 13% single-session decline. Both the S&P 500 and Nasdaq Composite fell more than 1%, with the S&P 500 slipping into negative territory for the year.
US equity index futures demonstrated modest recovery during Tuesday’s pre-market session. Dow futures advanced 0.1%, S&P 500 futures gained 0.2%, and Nasdaq 100 futures increased 0.3%.
What to Watch Next
Artificial intelligence company Anthropic has scheduled a product announcement for Tuesday. Historical patterns show that previous Anthropic product launches have precipitated declines in cybersecurity and software equities.
Consumer confidence statistics are scheduled for release Tuesday. Major earnings reports from Nvidia, Salesforce, and Snowflake are expected Wednesday.