
 Faces Continued Bearish Pressure Despite Encouraging PMI Data")
TLDR
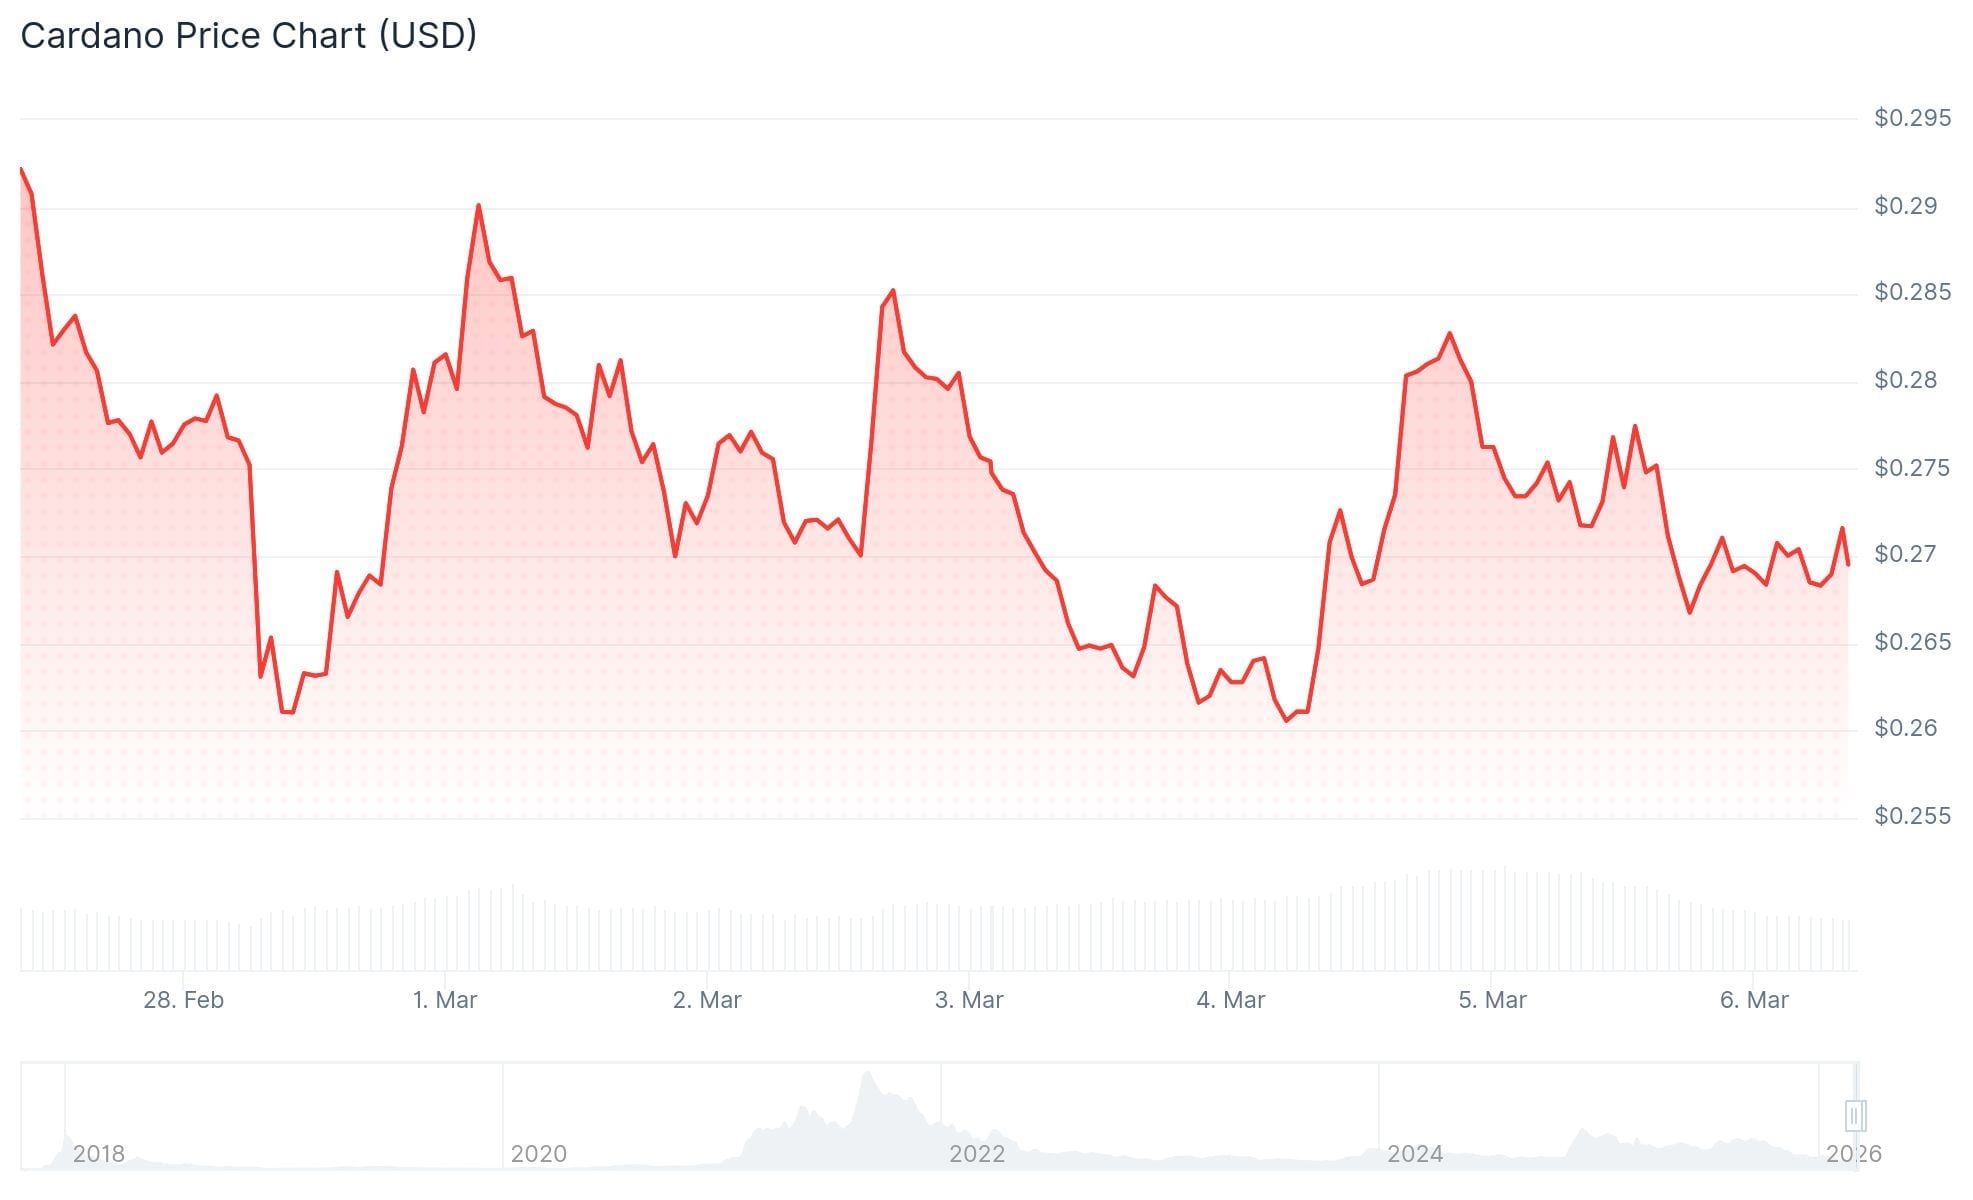
- Cardano is currently priced around $0.27, nearing a critical descending trendline at $0.28 that has consistently served as a rejection zone
- Futures open interest has declined to $462 million with the long-to-short ratio at 0.79, indicating dominant bearish sentiment
- The token remains significantly below both its 50-day and 100-day EMAs, which are positioned above $0.30
- With an RSI reading of 46, momentum remains subdued as the indicator stays below the neutral threshold of 50
- Manufacturing PMI has climbed to 52.4%, marking its third straight monthly gain over a 40-month period—a pattern historically linked to ADA price rallies
Cardano (ADA) continues to hover at $0.27 as of Thursday, March 6, with price action gravitating toward a significant descending trendline positioned near $0.28. This technical barrier has already pushed back against upward momentum in recent sessions and remains the primary obstacle for any near-term recovery.
Futures market data reinforces the bearish narrative. Open interest in Cardano futures contracts has contracted to $462 million, showing a consistent downtrend since mid-January.
When open interest declines alongside stagnant or falling prices, it typically indicates that market participants are exiting positions and reducing exposure.
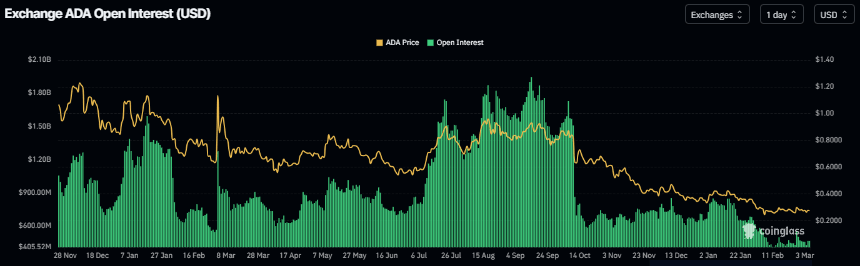
CoinGlass data reveals a long-to-short ratio of 0.79 at present. This reading marks one of the lowest levels recorded in more than a month, demonstrating that short positions currently outnumber long positions as traders anticipate further downside.
The altcoin is also positioned well beneath both its 50-day and 100-day Exponential Moving Averages, which remain clustered above the $0.30 level. This distance underscores the prevailing bearish market structure.
The daily Relative Strength Index stands at 46. Though it has climbed from oversold conditions, the indicator remains under the 50 centerline, reflecting continued weakness in upward momentum.
Meanwhile, the MACD indicator shows slight positive divergence, but the histogram appears flat. This configuration suggests consolidation activity rather than a definitive trend change.
Key Price Levels to Watch
Looking at upside targets, immediate resistance awaits at the trendline around $0.28. A more formidable barrier exists at $0.32, where descending moving averages also intersect.
A sustained daily close above $0.32 would be required to invalidate the current bearish formation.
Downside support is established at $0.26, with an additional horizontal base at $0.24. Should ADA breach the $0.24 level, it could trigger additional selling pressure.
In the near term, ADA appears positioned to trade within a $0.26 to $0.29 corridor unless a significant catalyst emerges to drive price beyond resistance.
Macro Indicator Points to Possible Shift
While Bitcoin recently climbed above $73,000 to reach a one-month peak, ADA failed to mirror this strength. The token recorded only modest gains and couldn’t sustain a close above the prior session’s high.
Crypto analyst Dan Gambardello has highlighted the manufacturing Purchasing Managers Index (PMI) as a significant indicator for Cardano’s medium to long-term price trajectory.
The PMI, which measures activity levels in the manufacturing sector, currently registers at 52.4%. This represents the third consecutive monthly increase over a 40-month timeframe.
Gambardello observes that previous periods of PMI growth have historically coincided with bullish cycles for ADA.
The present situation also shares similarities with the 2019 correction phase, when ADA experienced red monthly candles in six out of seven months before staging a substantial recovery.
Quantitative tightening concluded in December 2025. According to Gambardello, this development combined with an ascending PMI creates a macro environment similar to conditions that preceded Cardano’s previous major rally.
ADA is currently experiencing its sixth consecutive monthly red candle after closing February in negative territory.