
 Eyes $5,000 Price Target Following Weekly Chart Breakout")
Key Takeaways
- Crypto analyst Crypto Patel identifies a confirmed bull flag breakout on BNB’s higher timeframe charts, projecting a $5,000 long-term objective.
- Following the breakout, the $600–$700 range has established itself as critical support territory.
- Additional support levels are identified in the mid-$500 area, with a significant accumulation opportunity near the low $400 range.
- Technical indicators show RSI at 59, a bullish MACD configuration, and EMA convergence around $623, suggesting sustained buying momentum.
- Reaching the $5,000 objective requires continued ecosystem expansion, exchange market share, and favorable crypto market dynamics.
Binance Coin has captured market attention following technical analyst Crypto Patel’s identification of a bull flag breakout on the weekly timeframe, suggesting a potential long-term climb to $5,000.
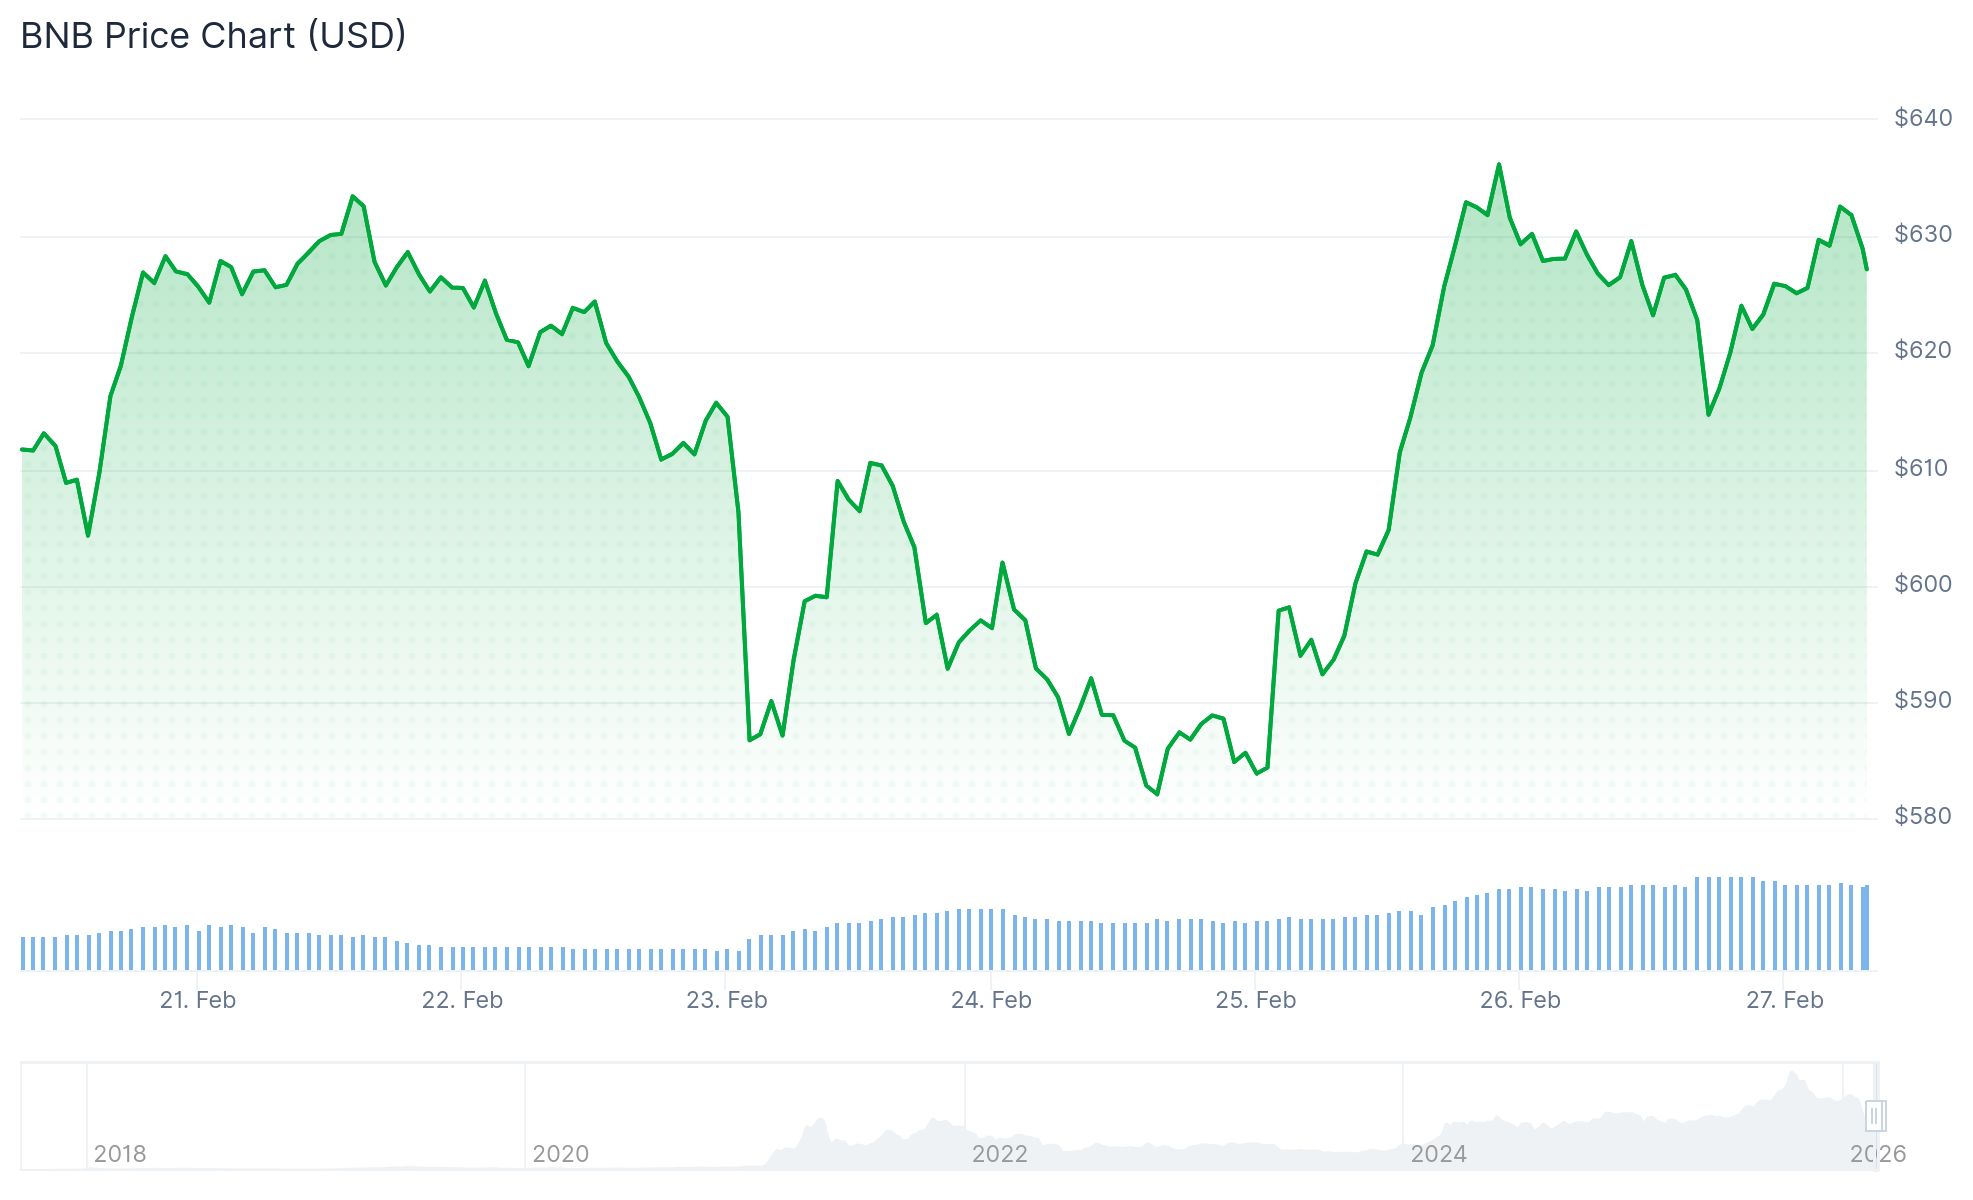
As of February 26, BNB was changing hands near $623, following a brief touch of $640 before experiencing a minor retracement.
In technical analysis, a bull flag configuration develops when a sharp upward price movement is followed by sideways consolidation. When price breaks above this consolidation phase, technical analysts interpret this as a continuation signal for the existing uptrend.
Patel presented a weekly timeframe chart demonstrating BNB’s escape from an extended compression pattern that formed after its prior cycle peak. The move beyond this consolidation zone validates the bullish flag structure, according to his analysis.
The $600–$700 territory has emerged as a critical support region. Maintaining price action above this zone keeps the bullish scenario viable based on the technical assessment.
Critical Support Zones Under Observation
Beneath the current trading range, another support level exists in the mid-$500 territory. Should a more substantial correction materialize, BNB could decline to an optimal “accumulation zone” positioned near the low $400s, as outlined in Patel’s chart analysis.
Invalidating this bullish technical structure would require a significant breakdown on the higher timeframe charts, which hasn’t materialized at present.
Technical Indicator Analysis
According to TradingView data, several exponential moving averages — the 20-period, 50-period, 100-period, and 200-period — are clustering near the $623 level, establishing it as an important short-term battleground.
The Ichimoku Cloud indicator displays price action hovering just above the cloud formation, signaling moderately bullish momentum. The Kijun and Tenkan lines are positioned beneath current price levels, offering support in the $615–$623 territory.
The Relative Strength Index registers 59, positioned above the neutral 50 level, indicating moderate bullish strength. The RSI’s moving average shows an upward trajectory.
The MACD indicator sits above its signal line, with both positioned in positive territory. The expanding positive histogram reflects that buying pressure currently dominates.
A sustained close above $623 may facilitate movement toward the $630–$635 range. Conversely, a breakdown below $615 and the Ichimoku Cloud could trigger a decline toward $608–$610.
The $5,000 price objective represents a long-term forecast contingent upon ecosystem development, exchange platform dominance, and broader cryptocurrency market sentiment — rather than an immediate trading target.
As of February 27, BNB maintains its position above the $620 threshold with technical metrics supporting the prevailing bullish outlook.