
 Faces Turbulent May 2026 as Inflation and Derivatives Signal Pressure")
Contents
Key Highlights
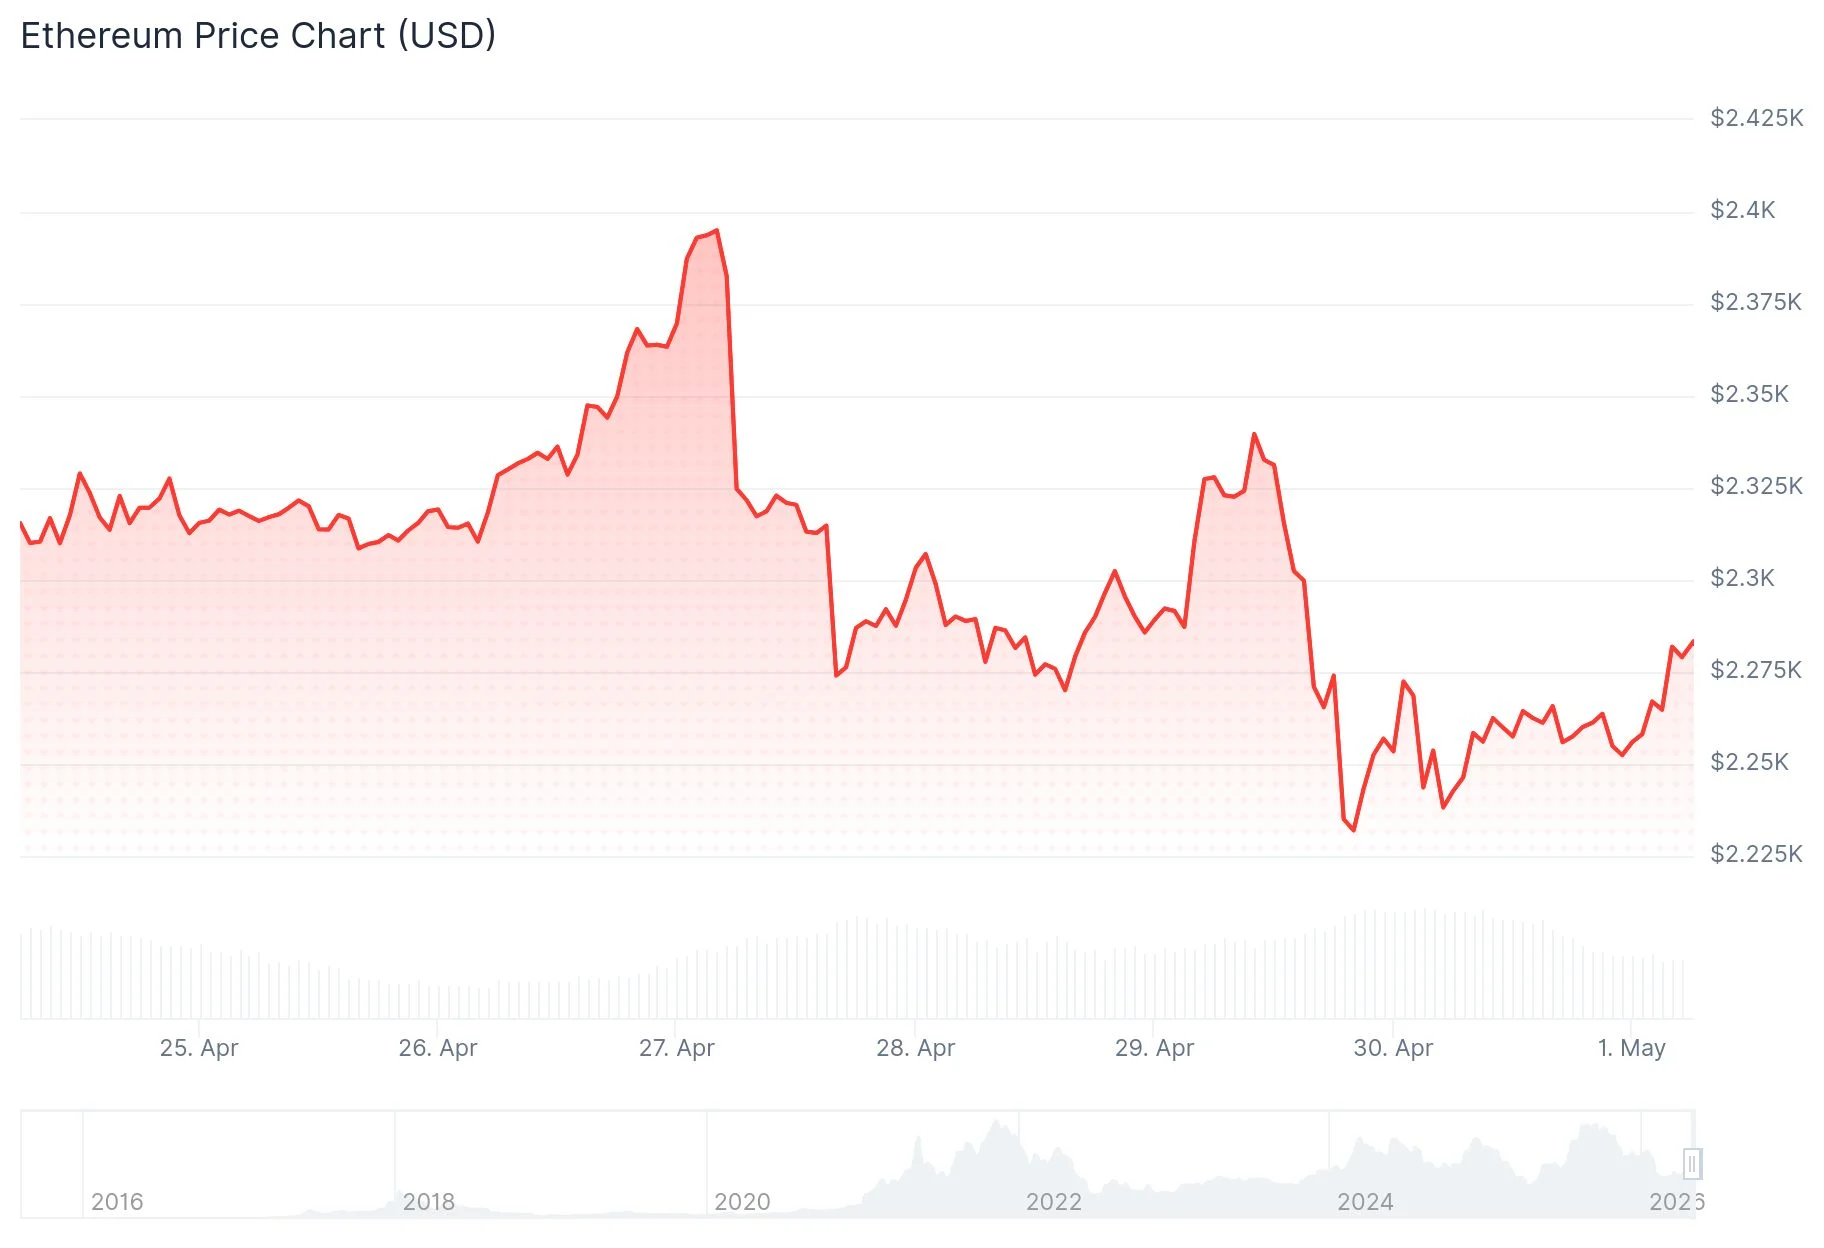
- Ethereum currently hovers near $2,260, pressured by elevated US inflation readings and broader macroeconomic uncertainty.
- Derivatives market indicators reveal negative taker buy-sell ratios alongside negative funding rates, reflecting short-term bearish sentiment.
- Crypto analyst Ted Pillows identifies $2,150–$2,200 as a pivotal zone, warning that a breach could accelerate downside momentum.
- Binance-specific data shows taker buy-sell ratios above 1, suggesting more aggressive buying activity on that exchange.
- Historical patterns reveal May as Ethereum’s most volatile month, characterized by extreme price swings in either direction.
Ethereum is currently positioned around $2,260 as a combination of macroeconomic pressures and conflicting derivatives signals defines the near-term trajectory entering May.
The latest US Personal Consumption Expenditures (PCE) Price Index registered a 3.5% year-over-year increase for March, rising from February’s 2.8%. Meanwhile, core PCE—the Federal Reserve’s preferred inflation gauge—reached 3.2%, marking the highest reading since November 2023. Elevated inflation diminishes expectations for near-term interest rate reductions, which generally dampens investor appetite for riskier assets including cryptocurrencies.
Ongoing geopolitical developments in the Middle East are further contributing to a risk-off environment across global markets.
Within Ethereum’s futures ecosystem, the taker buy-sell ratio has dipped below zero. This indicator measures the balance between market order buyers and sellers in perpetual contracts. The 14-day moving average for this metric has been declining steadily since mid-April.

Concurrently, ETH funding rates have remained in negative territory throughout this timeframe. When funding rates turn negative, short-position holders pay long-position holders, indicating a prevalence of bearish sentiment among leveraged traders.
Open interest has stabilized around 13.5 million ETH, declining from the 14.4 million ETH recorded on April 18. This reduction indicates that market participants are closing positions rather than initiating fresh trades.
Critical Technical Levels Under Watch
From a technical perspective, ETH is currently positioned beneath its 20-day exponential moving average at $2,287 and the 100-day EMA near $2,365. The Relative Strength Index (RSI) lingers around the neutral 50 threshold, while the Stochastic Oscillator has entered oversold conditions.
Ethereum’s realized price—representing the average acquisition cost across all on-chain holdings—stands at $2,308, functioning as a resistance barrier. Recent price action has repeatedly failed to surpass this threshold, suggesting profit-taking among holders reaching breakeven.
Immediate support is established at $2,211, with the 50-day EMA positioned near $2,244. Should these levels fail, subsequent support zones emerge at $2,108, $1,909, and $1,741.
Crypto market analyst Ted Pillows has highlighted the $2,150–$2,200 range as critically important, cautioning that a breakdown below this area could mean “the dump will accelerate.” He views this zone as potentially forming a foundation for renewed upward momentum.
Over the past 24 hours, ETH experienced $38.2 million in total liquidations, with short positions accounting for $19.5 million of that figure.
Binance Metrics Suggest Bullish Positioning
Zooming into Binance-specific activity, the taker buy-sell ratio exceeds 1, based on CryptoQuant information highlighted by analyst Rei Researcher. This diverges from the broader market sentiment, indicating that aggressive buyers are currently dominating on Binance’s platform.
Open interest on the exchange has experienced modest increases from recent lows, hinting at gradual accumulation of long positions. Nevertheless, overall leverage expansion remains constrained, which minimizes the probability of cascading liquidation events.
May’s Historical Volatility Signature
According to historical market data compiled by CoinGlass, May consistently ranks among Ethereum’s most volatile calendar months. Both average and median returns for May occupy the extreme ends of the spectrum—delivering significantly larger gains or steeper losses compared to other months.
Market analyst Daan Crypto Trades emphasized this historical tendency, observing that May typically generates dramatic directional moves rather than gradual, steady trends.
ETH commenced May 2026 trading in the vicinity of $2,261.