
 Eyes Recovery After 68% Decline as Institutional Interest Awakens")
Quick Overview
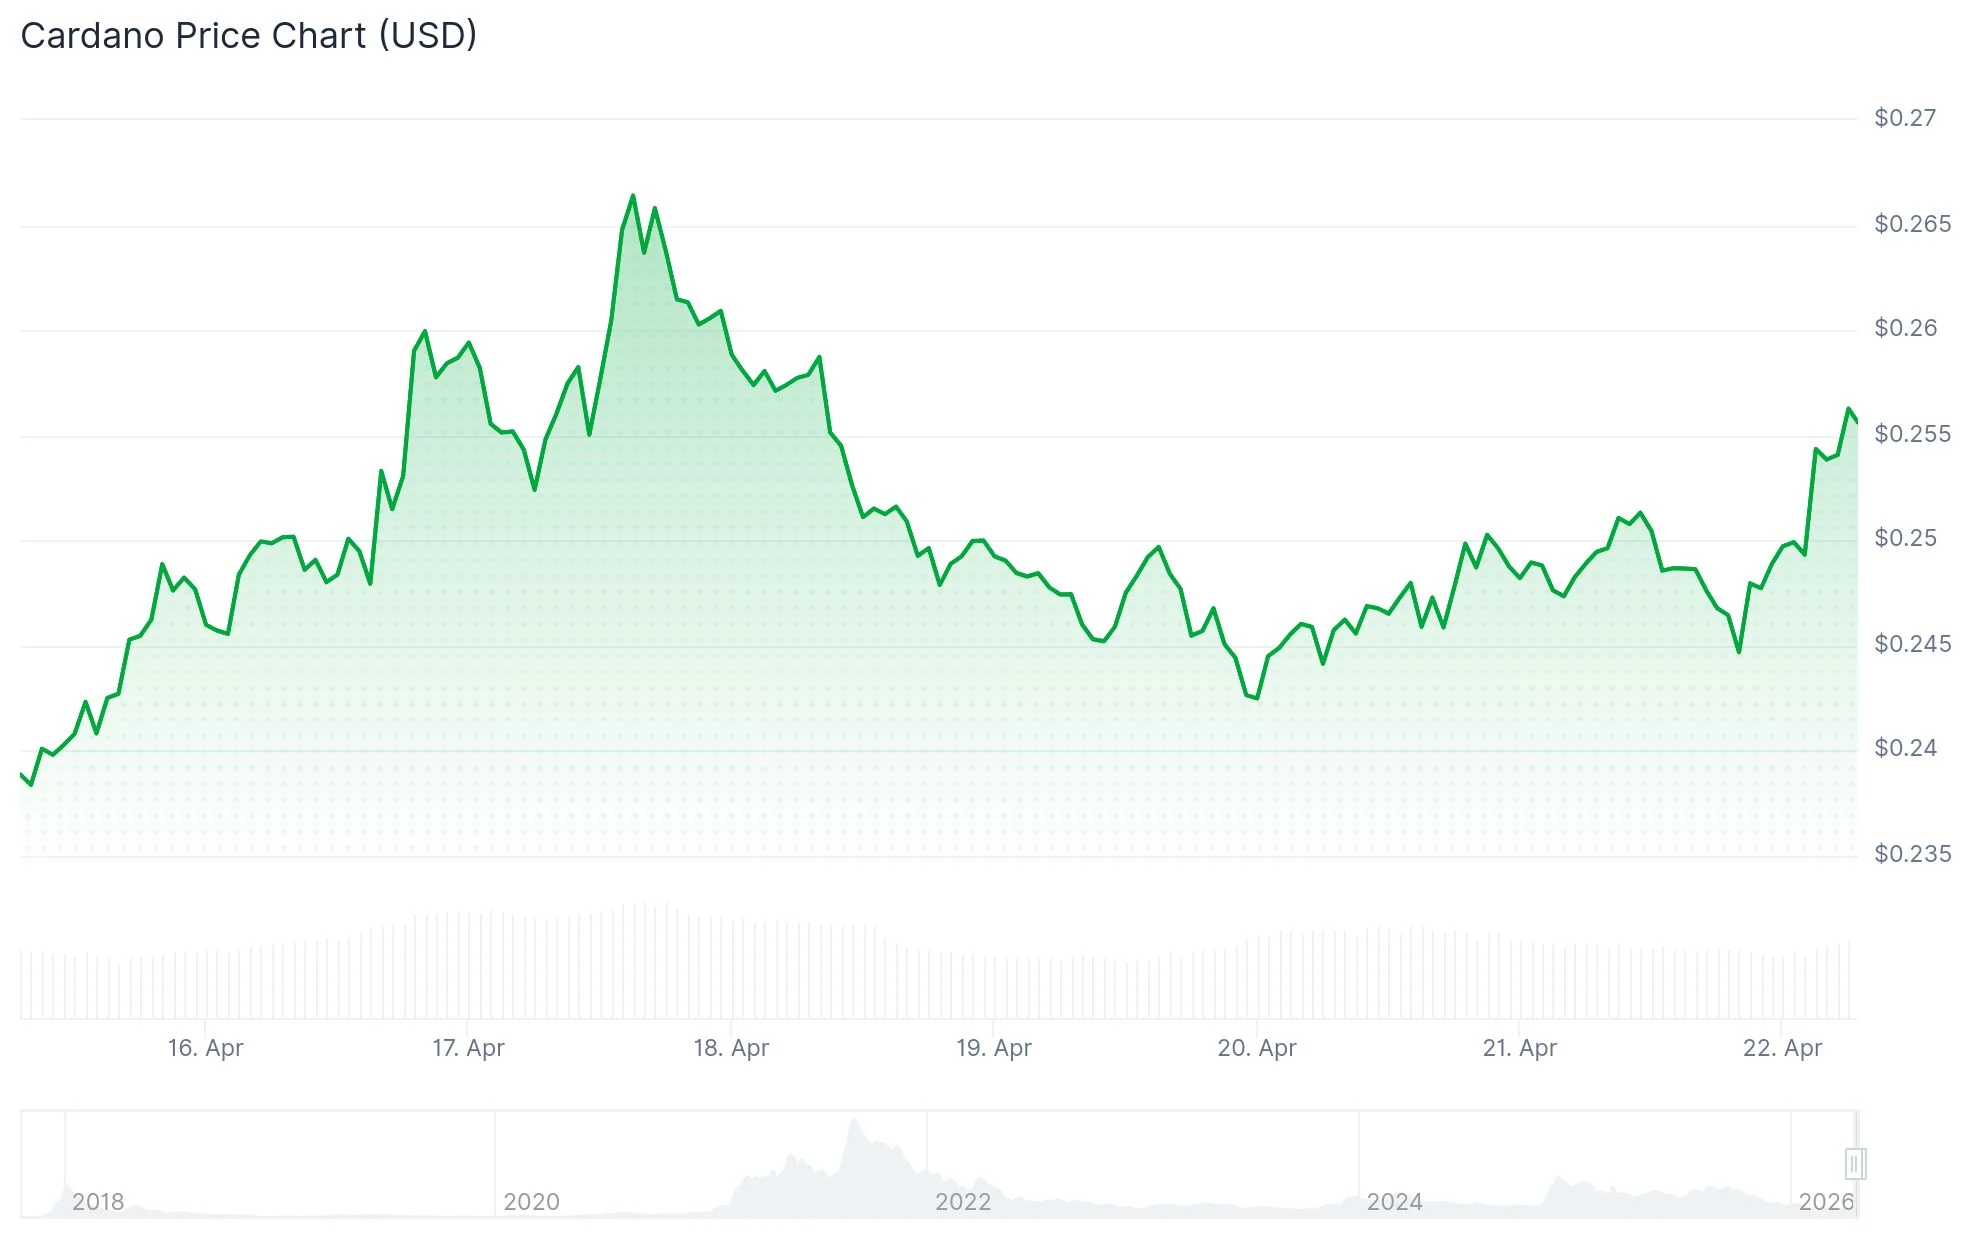
- ADA currently hovers near $0.25 with modest gains recorded on April 21
- CME futures contract volumes exploded 155% over two sessions, climbing from 27 to 69 contracts
- Open Interest in ADA futures climbed more than 5% within 24 hours, reaching $459.02 million
- Technical charts reveal a falling wedge formation with breakout targeting the $0.30 level
- Current long/short positioning at 0.73 creates conditions favorable for a potential short squeeze
Cardano (ADA) has experienced sustained bearish pressure since mid-January, plummeting 68% from its peak of $0.42 on January 14 to its current price near $0.25. However, recent market dynamics indicate the altcoin may be positioning for a potential reversal.
The cryptocurrency market’s fear and greed index has climbed from 12 to 33 throughout the past seven days. Although still registering within “fear” territory, this upward movement indicates diminishing sell-side pressure across the sector.
Open Interest for ADA futures tracked by CoinGlass surged over 5% during a 24-hour period, touching $459.02 million. A positive funding rate of 0.0090% demonstrates that market participants are prepared to pay additional costs to maintain bullish positions.

Data from CME Group reveals that ADA futures contract volumes rocketed from 27 contracts on April 15 to 69 contracts by April 17. This 155% surge across merely two trading sessions signals heightened institutional participation in the asset.
The prevailing long/short ratio stands at 0.73, indicating a greater number of traders holding short positions compared to longs. This imbalanced positioning creates vulnerability to rapid upward price movement, which could force liquidations of short contracts and amplify bullish momentum.
Funding rates have intermittently dipped into negative territory, signaling that market participants are incurring costs to maintain bearish positions. Such conditions often precede short squeeze events when price action accelerates upward unexpectedly.
Technical Breakdown
Chart analysis shows ADA has emerged from a falling wedge formation. Confirmation of a genuine bullish reversal requires multiple consecutive daily closes above the pattern’s upper boundary.
Measuring the wedge’s height projects a potential advance from the $0.25 level to $0.30, representing approximately 23% upside. Technical analysts emphasize that $0.28 must first be conquered before $0.30 becomes a viable objective.
The 50-day exponential moving average positioned at $0.26 currently serves as the primary resistance barrier. The 100-day EMA rests at $0.3009 while the 200-day EMA sits at $0.3953, both presenting significant overhead challenges.
The Relative Strength Index currently reads around 51, indicating momentum has stabilized but hasn’t yet generated powerful bullish conviction. Market participants appear cautious at present resistance zones.
The MACD histogram registers marginally above its signal line, producing a slightly positive reading. While this suggests potential for trend reversal, it hasn’t yet confirmed strong directional momentum.
Critical Support Zones
On the bearish side, ADA maintains crucial support at $0.2328, corresponding to the March 29 trough. Should that level fail, the February 6 low of $0.2205 would serve as the subsequent support threshold.
As of April 21, ADA was changing hands at roughly $0.2554, sustaining its position above the psychologically significant $0.25 mark for three straight days. The 50-day EMA at $0.26 represents the next immediate obstacle for any sustained upward movement.