
 Faces Critical Test at $83 as ETF Outflows Surge in April 2025")
Quick Summary
- Solana maintains position around $83, constrained beneath a falling trendline and critical exponential moving averages
- Spot Solana ETFs experienced $17.08 million in capital withdrawals this week, with Tuesday marking an unprecedented $15.40 million single-session exodus
- Derivative traders faced $7.99 million in liquidations during the past day, predominantly affecting bearish positions
- The 50-day EMA positioned around $87–$88 represents the critical overhead barrier
- Technical analyst Ali Martinez identified a recurring price behavior where SOL momentarily breaks above the 50-day MA before subsequent declines
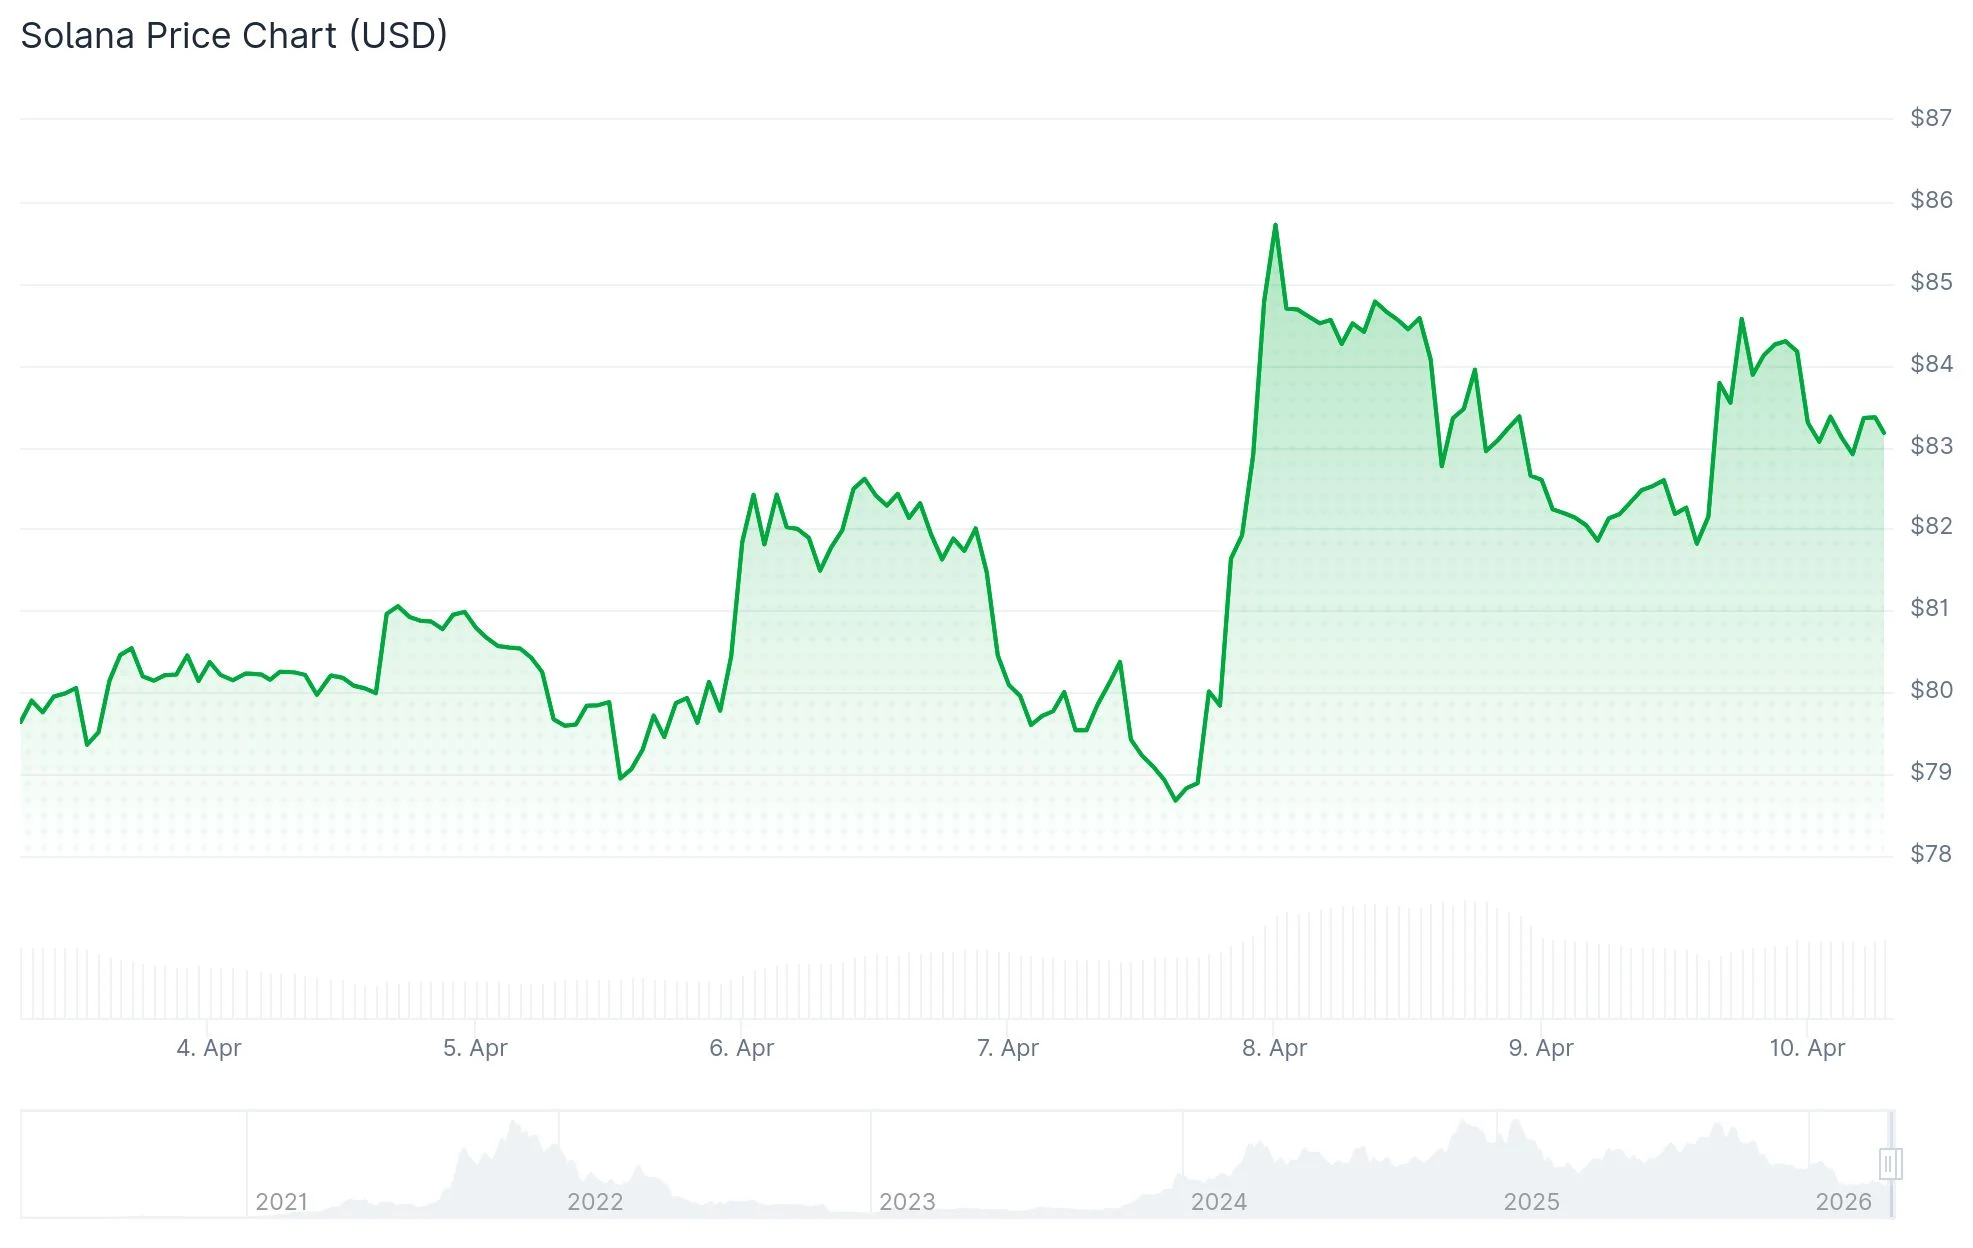
Solana continues to consolidate near $83 as of Friday, April 10, maintaining a position above the psychologically important $80 threshold while failing to generate meaningful upward momentum. The digital asset remains pressured beneath its 50-day, 100-day, and 200-day Exponential Moving Averages (EMAs), creating a neutral-to-bearish technical environment.
A downward-sloping resistance line drawn from the January 14 peak through the April 7 high continues to cap upside attempts, aligning with the 50-day EMA in the $87–$88 range. Multiple attempts to breach this confluence zone have been rejected.
The Relative Strength Index (RSI) currently reads 47, indicating neutral momentum with neither bulls nor bears in control. Meanwhile, the Moving Average Convergence Divergence (MACD) displays a marginally bullish signal, though insufficient to confirm a definitive trend reversal.
Institutional Capital Flight Accelerates
Institutional appetite for Solana exposure has deteriorated markedly during the current week. United States-listed spot SOL exchange-traded funds registered cumulative outflows totaling $17.08 million, highlighted by Tuesday’s historic single-day withdrawal of $15.40 million.

Persistent ETF redemptions generally signal institutional risk reduction and frequently contribute to bearish price pressure in underlying spot markets.
In futures markets, CoinGlass tracking reveals $7.99 million in forced position closures during the last 24-hour period. Notably, $5.97 million of these liquidations affected short positions, indicating bears were caught offside. Open Interest contracted 1.48% to $4.78 billion, suggesting diminishing participation across derivative venues.
The OI-weighted funding rate maintains a modest positive reading of 0.0038%, while the long-to-short ratio stands at 1.0141, indicating a slight preference for bullish positioning among active traders.
Technical Expert Identifies Bearish Repetition
Cryptocurrency technical analyst Ali Martinez published observations on X documenting a pattern that has materialized three separate times since November 2025. In each instance, SOL temporarily recovered above the 50-day Moving Average only to fail at sustaining the level, followed by consolidation and subsequent sharp corrections.
Martinez emphasized that prolonged trading beneath the 50-day MA increases the probability of another downside leg based on established historical precedent.
Solana has been locked within a $78–$92 trading corridor throughout most of the period following March 5’s volatile session, which witnessed an intraday collapse from $92 to $78.
For bulls, a confirmed daily close above $88 would expose the 100-day EMA near $99.86 as the subsequent upside objective. Conversely, a breakdown below $80 would activate support zones at $76.50, with AMBCrypto’s February analysis identifying $47.90 as a potential longer-term downside target based on weekly timeframe structure.
Immediate resistance for SOL is established at $85, followed by $88. Critical support levels include $82.50, $81.40, and the pivotal $80 zone.