
 Surges 5% as Trading Volume Spikes 50% — $600 Price Target in Focus")
Key Highlights
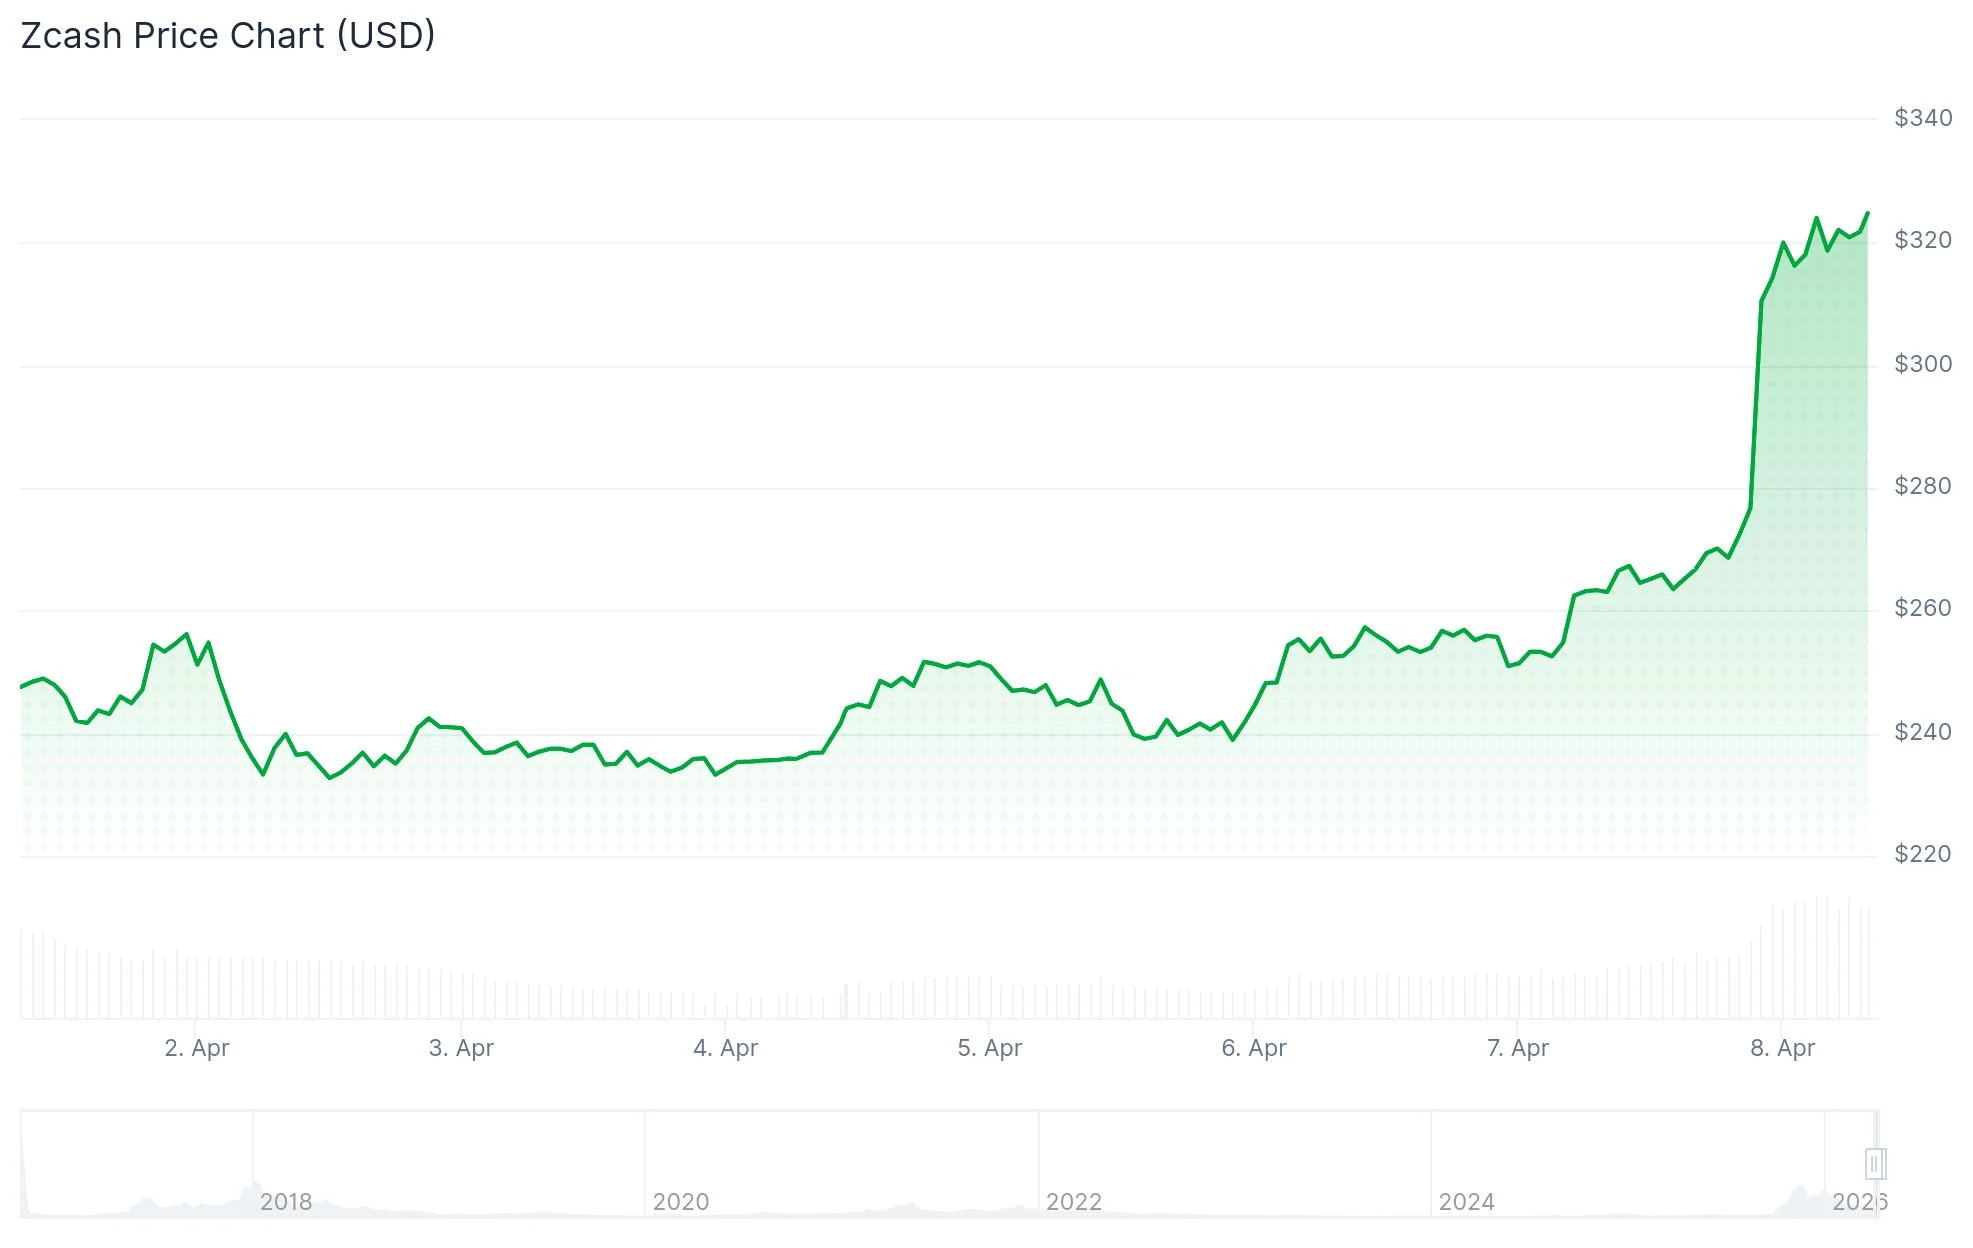
- ZEC surged more than 5% during Tuesday’s trading session, advancing from $256.45 to approximately $269
- The token is now challenging a critical resistance area around $270 following a breach of a falling trendline
- For the first time since dropping from elevated levels, ZEC has recovered its 50-day exponential moving average
- Trading volume over a 24-hour period spiked 50.1%, reaching $458.23 million
- Market observers have identified upside objectives at $300, with extended projections reaching $600 in favorable scenarios
Zcash (ZEC) recorded an upward move exceeding 5% during Tuesday’s session on April 7, advancing from the $256.45 mark to approximately $269. Currently, ZEC is changing hands at $269.66 with a total market capitalization of $4.48 billion, based on data from CoinMarketCap.
The 24-hour trading volume hit $458.23 million, representing a 50.1% increase. This surge in market activity suggests heightened interest and participation from traders on leading cryptocurrency platforms.
Looking at the weekly performance, ZEC has appreciated 7.13% over the last seven days. This gain stands out as much of the cryptocurrency market has experienced sideways consolidation or downward pressure during the same timeframe.
The current price action has pushed ZEC into a significant resistance area near $270, a threshold that has previously rejected multiple rally attempts over recent months. Whether the price can break through and maintain levels above this barrier has become the primary focus for market participants.
Notably, ZEC has successfully reclaimed its 50-day exponential moving average on the daily timeframe. This marks the first instance of such a recovery since the token declined from higher valuations earlier in the year. Technical analysts view this development as evidence of changing market dynamics.
Technical Formation Emerges
Cryptocurrency analyst Ardi has identified a dual-level breakout configuration. ZEC is simultaneously testing horizontal resistance near $270 and a descending trendline that has constrained price action since January. A decisive daily candle close above this convergence zone would eliminate both technical obstacles simultaneously.
Should this breakout materialize, technical analysts anticipate price advancement toward $300 as the subsequent significant milestone. Alternatively, if the breakout attempt proves unsuccessful, ZEC may retrace toward the $200–$220 support area.
Analyst Whales_Crypto_Trading has drawn attention to a falling wedge pattern visible on the 12-hour timeframe. This chart formation typically precedes bullish reversals. The analyst’s near-term price objectives center around $300, while extended targets reach $600 should upward momentum persist.
Technical Indicator Assessment
The Relative Strength Index on the daily chart currently registers around 63. This reading indicates solid buying momentum while remaining outside overbought territory. The MACD indicator is similarly displaying constructive signals, with its lines exhibiting bullish crossover activity.
Both the 50-day and 200-day simple moving averages are currently positioned beneath the prevailing price, confirming that an upward trend structure remains intact.
Bollinger Bands have begun expanding, signaling the continuation of elevated volatility conditions. Near-term support is identified around $249, while overhead resistance appears near $290.
From a trading perspective, analyst Ardi recommends establishing long positions between $260 and $268 during pullbacks, while maintaining a protective stop loss at $238. Profit-taking levels are designated at $282, $295, and $310.
At present, ZEC is trading at $269.66 with 24-hour volume standing at $458.23 million, marking a 50.1% increase compared to the prior session.