
 Tests Critical $1.40 Resistance Level Amid Bullish Momentum")
Key Takeaways
- XRP surged past a descending trend line on the hourly timeframe, signaling renewed bullish pressure.
- The cryptocurrency peaked at $1.3963 before experiencing minor consolidation, maintaining position above the 100-hour moving average.
- Critical resistance between $1.3880 and $1.40 represents the primary barrier for continued upside movement.
- Downside protection is established around $1.3575 and $1.3330 should momentum fade.
- Broader market developments include significant ETF capital inflows and regulatory advancements, though technical indicators present conflicting signals.
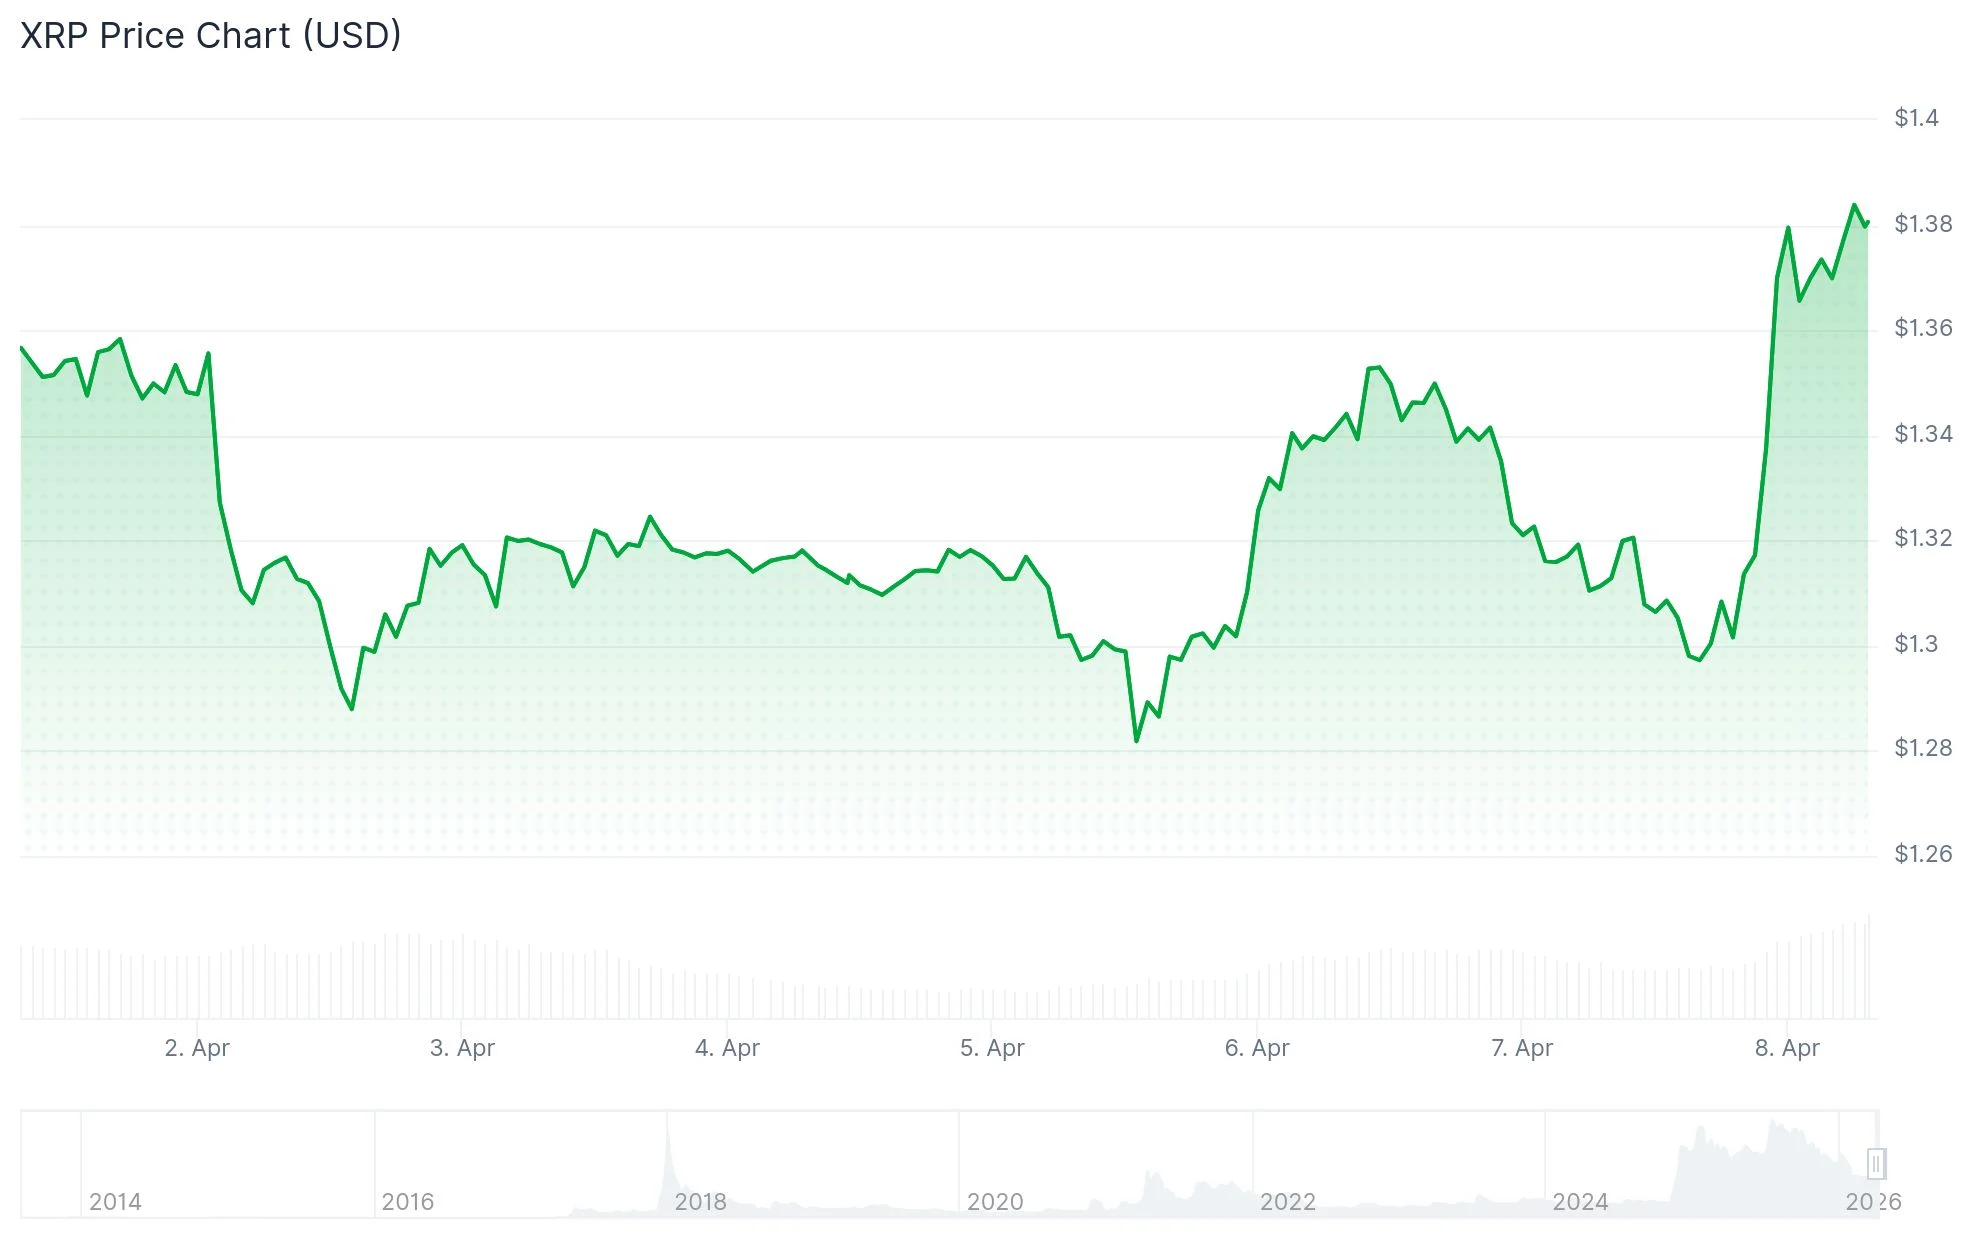
XRP (XRP) extended its upward trajectory and neared the psychologically significant $1.40 threshold following a robust intraday advance. The digital asset hovered around $1.38 after establishing an intraday peak of $1.3963.
The upward momentum originated after XRP successfully breached the $1.350 and $1.3550 thresholds. Market participants subsequently drove prices through the $1.3650 resistance barrier.
Analyzing the hourly chart reveals XRP penetrated a downward sloping trend line positioned near $1.3350. This technical breakout provided additional fuel for the current price expansion.
Following the $1.3963 high, XRP experienced modest profit-taking. Nevertheless, the price maintained its position above both $1.3550 and the 100-hour simple moving average.
This positioning directs market focus toward the subsequent resistance barrier. Market participants are closely monitoring whether XRP can overcome $1.3880 before tackling $1.40.
Critical Resistance Levels Under Scrutiny
Should XRP successfully breach $1.40, subsequent upside objectives emerge around $1.4250 and $1.4450. A more extended rally could encounter obstacles near $1.4650.
Near-term technical configurations suggest bullish participants maintain dominance currently. The trading pair continues holding above its primary moving average following the recent advance.
Additional market analysis indicated XRP registered a 5.63% daily gain, trading near $1.3848. This assessment positioned XRP above its 20-day moving average, though remaining beneath both the 50-day and 200-day moving averages.
Identical data identified the Ichimoku Kijun at approximately $1.4429. This benchmark resides above current market pricing and reinforces the overhead resistance territory.
Key Support Zones Provide Downside Protection
Should XRP encounter rejection at the $1.3880 resistance area, downward pressure could reemerge. Initial support materializes around $1.3575.
Further down, substantial support appears near $1.3330. This threshold coincides with the 61.8% Fibonacci retracement measuring the rally from $1.2940 through $1.3963.
A decisive break beneath $1.3330 would potentially expose the $1.3080 and $1.3020 regions. The following significant support floor beneath these areas resides near $1.2750.
Separate analysis noted XRP has consolidated within a narrow $1.37 to $1.39 corridor, despite robust institutional investment flows. The assessment highlighted that US spot XRP ETFs have accumulated over $1 billion since their introduction, with $224 million entering during the most recent week.
The identical assessment noted momentum oscillators displayed divergent readings, with RSI exhibiting bullish characteristics while Stoch RSI indicated overbought territory. Market analyst Anton Kharitonov expressed a cautious stance pending a definitive break above $1.39.
Finance Bull highlighted XRP’s potential breakout following the two-week ceasefire agreement and Strait of Hormuz reopening developments, suggesting these catalysts could fuel two weeks of positive price action. The commentary conveyed strong optimism, though specific chart-based price targets beyond this perspective were not provided.
Presently, the most relevant technical barrier remains evident: XRP confronts the $1.3880 to $1.40 resistance zone following its advance from $1.2940.