
 Faces Critical Breakout as Whales Accumulate 500M Tokens Amid Bollinger Squeeze")
Key Takeaways
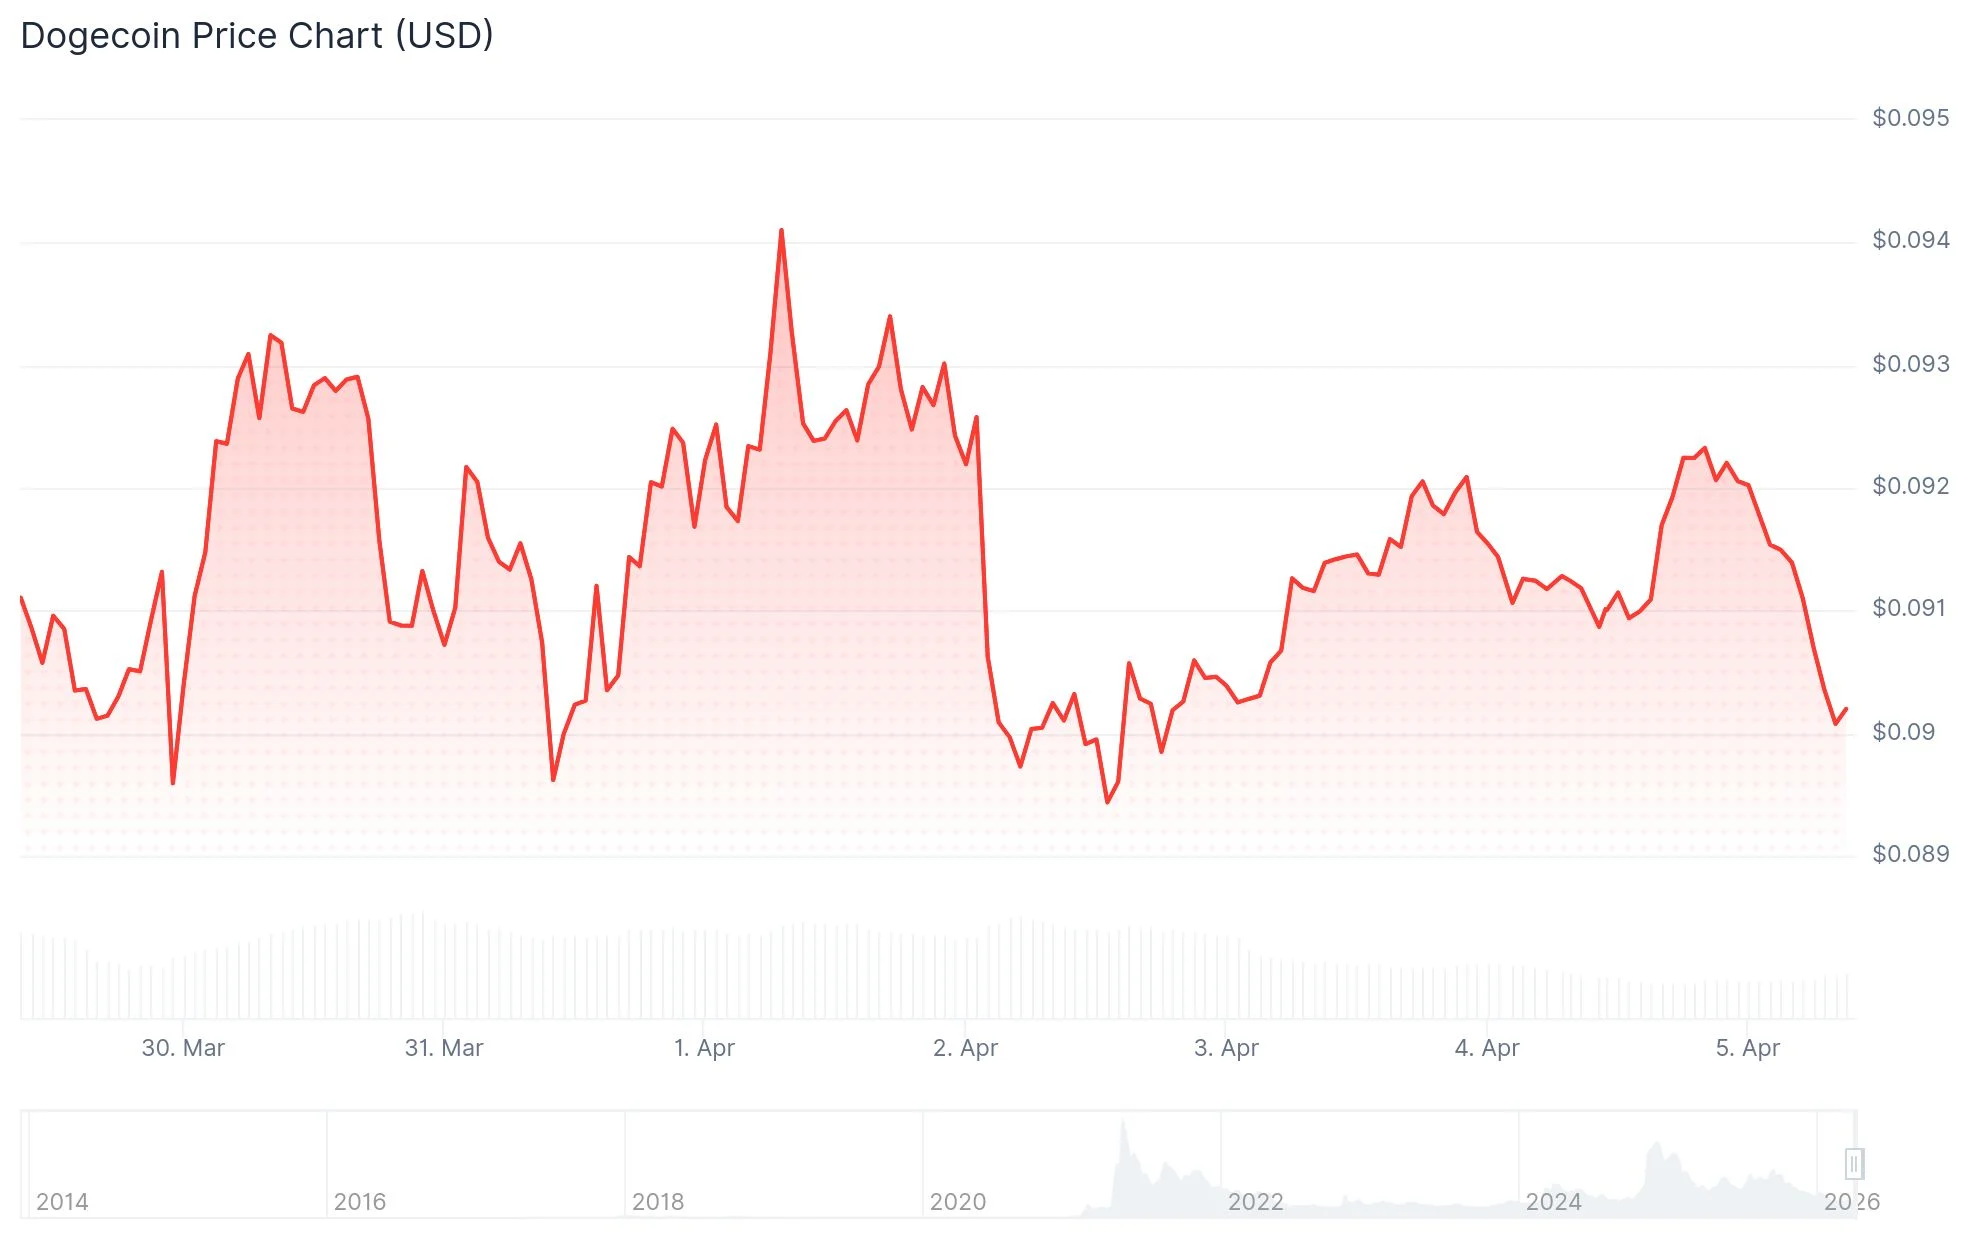
- DOGE currently trades near $0.091, experiencing a decline exceeding 5.5% across the last 30 days, while 24-hour trading activity has contracted approximately 25% to $530–$543 million.
- Technical indicators reveal a Bollinger Band compression on the daily timeframe, a pattern that historically signals significant upcoming volatility.
- Large-scale investors have discreetly purchased more than 500 million DOGE tokens beginning March 31, 2026, throughout the ongoing consolidation phase.
- Breaking above $0.095 on a daily close might catalyze a 26% rally, whereas dropping beneath $0.08821 could push DOGE down to the $0.055 level.
- Derivatives data shows bullish positioning dominance, with long liquidations totaling $11.61 million compared to $9.21 million in short positions at critical thresholds.
Dogecoin currently finds itself confined within a narrow trading channel, hovering near the $0.091 mark following several weeks of sideways movement. The popular meme cryptocurrency has shed over 5.5% in value during the previous month, accompanied by a significant 25% contraction in trading volume, which now registers between $530 and $543 million across a 24-hour window. This volume decline indicates considerable trader hesitation and reduced market participation.
Yet amid this sluggish price movement, a notable development emerges: substantial accumulation by major holders.
Starting from March 31, 2026, cryptocurrency whales have systematically acquired over 500 million DOGE tokens. This accumulation occurred throughout a consolidation period that saw prices oscillating between $0.087 and $0.101, a boundary the asset has maintained for more than seven days. This concentrated buying activity from significant market participants has drawn considerable attention from market analysts tracking the cryptocurrency.
A prominent cryptocurrency analyst highlighted this information via X, noting that the accumulation trend coincides with a textbook Bollinger Band Squeeze formation visible on the daily chart. Historically, this compression pattern — characterized by volatility contracting into narrow bands — frequently signals an impending substantial price movement in one direction or another.
Critical Price Zones Under Scrutiny
Examining the daily timeframe, DOGE appears to be developing a descending triangle formation. This pattern continues to tighten, suggesting an imminent directional breakout could materialize shortly.
The bullish scenario presents clearly: should DOGE achieve a daily candle close exceeding $0.095, market analysts anticipate a potential 26% price rally. Such a move would elevate the price toward approximately $0.119. The Bollinger Bands technical framework similarly suggests a possible advance toward $0.108972 should buying momentum intensify.
However, downside exposure remains present. Should DOGE breach support at $0.08821, the subsequent substantial floor exists considerably lower around $0.055.
The Average Directional Index (ADX) presently registers 13.69, significantly beneath the critical 25 benchmark. This reading confirms weak trending strength and indicates the market lacks clear directional conviction at this juncture.
Futures Market Positioning and Market Psychology
Within the derivatives arena, bullish traders maintain a marginal advantage. Information from CoinGlass reveals $11.61 million concentrated in long positions compared against $9.21 million in short positions surrounding key liquidation zones at $0.0895 and $0.0932. Open Interest has experienced a modest 0.75% reduction, suggesting some diminished trading activity.
Certain market participants are observing April with heightened attention. Historical patterns show April has proven favorable for DOGE. During 2021, the meme token experienced a remarkable 531% surge throughout this month, ultimately climbing to $0.453. While historical performance cannot guarantee future outcomes, this precedent remains a reference point for some investors.
Currently, DOGE trades at $0.091 characterized by subdued volume and a compressed volatility configuration. The subsequent meaningful price movement will likely hinge on whether a daily candle successfully closes above the $0.095 threshold.