
 Struggles Below $2,100: Key Catalysts Needed for a Breakout Above $2,400")
Key Highlights
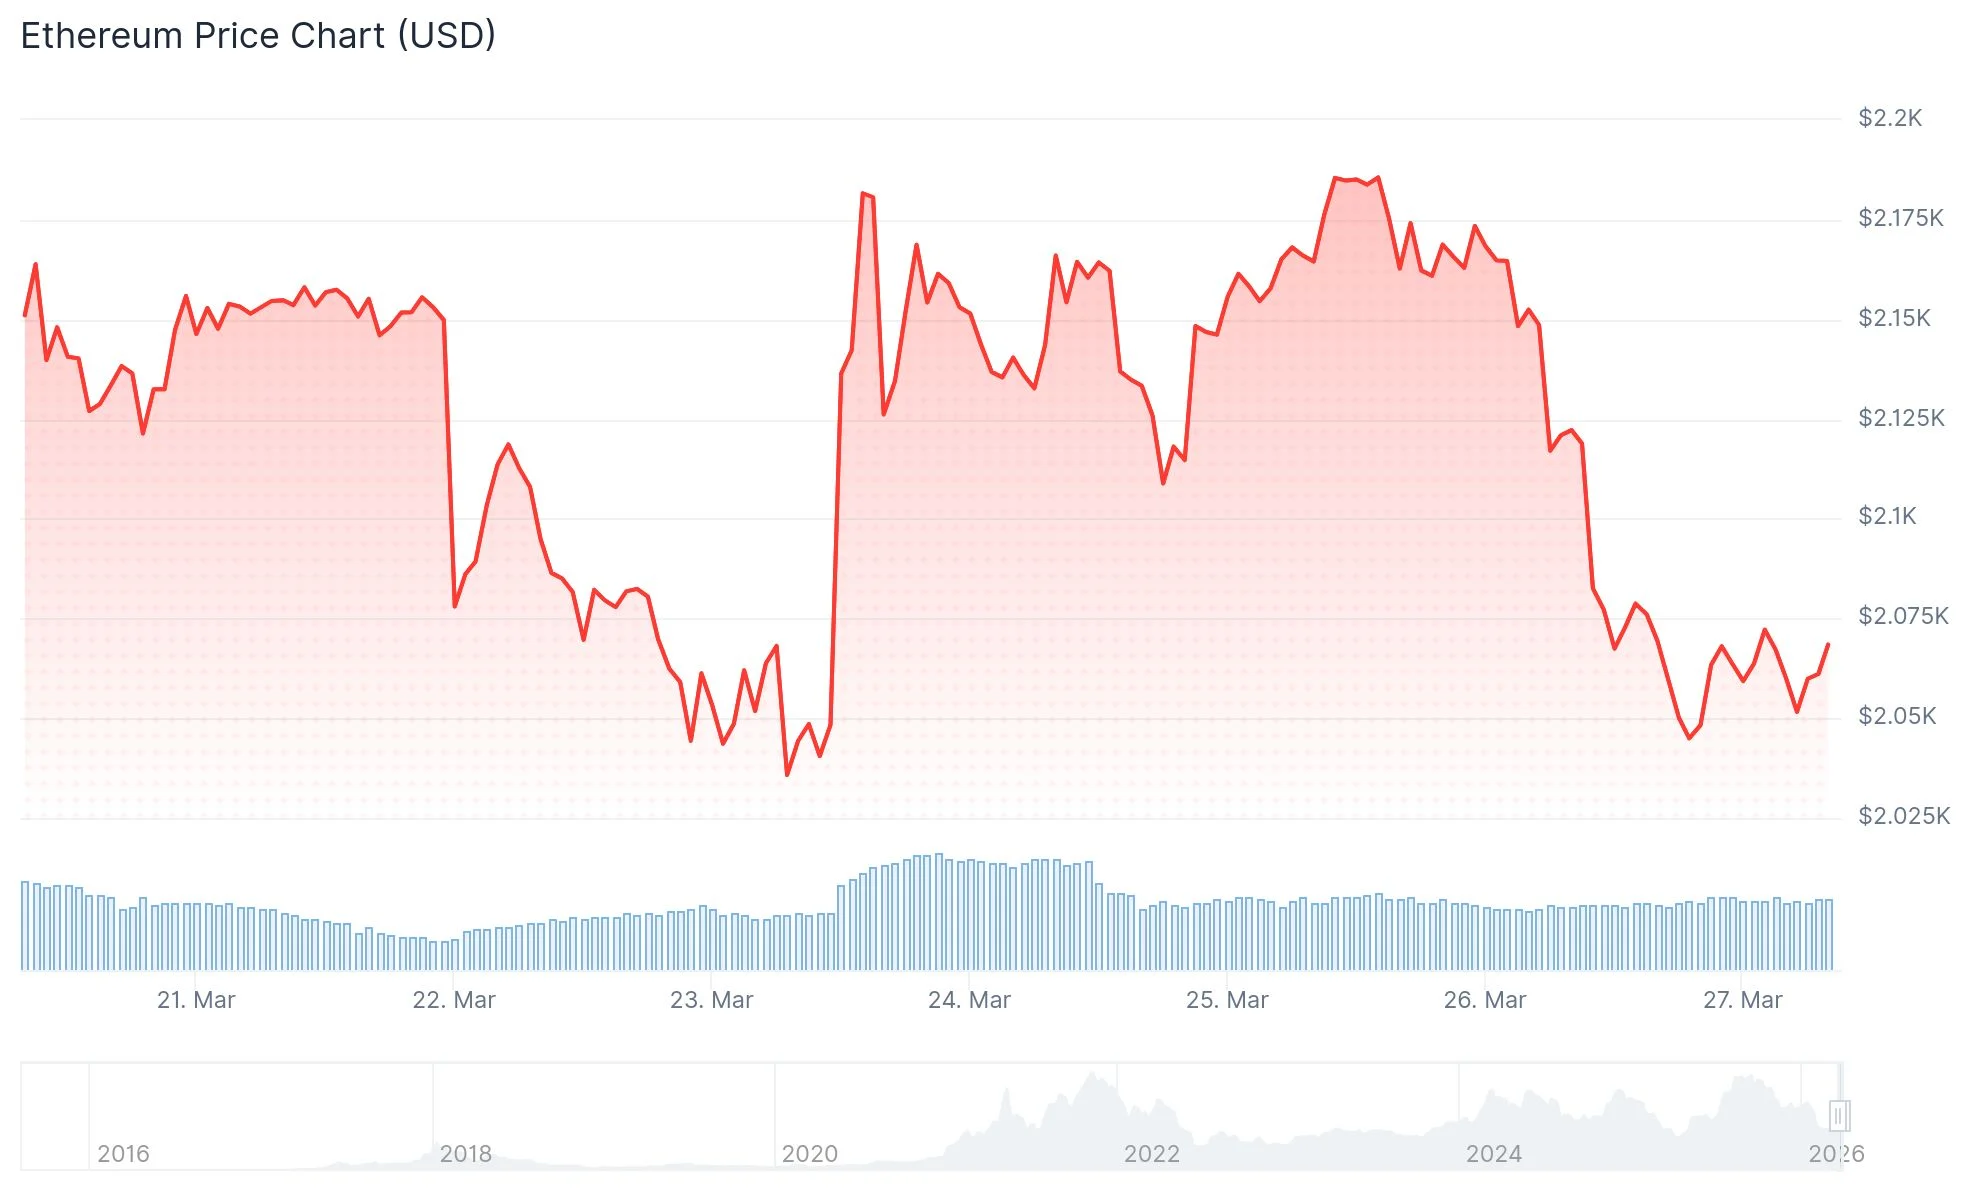
- Ethereum has declined 31% year-to-date, currently priced near $2,066.
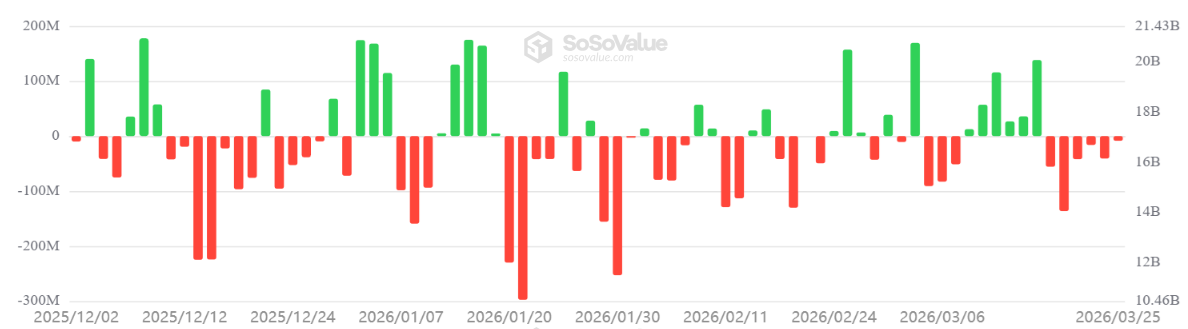
- Spot Ethereum ETFs in the US experienced $298 million in net redemptions across six consecutive sessions.
- Decentralized exchange activity on Ethereum has dropped approximately 50% compared to late 2025 figures.
- Ethereum futures contracts show only a 2% premium, significantly below the healthy 4–8% benchmark.
- Network activity reached all-time highs with 3.64 million weekly active addresses, while exchange-held ETH touched decade lows.
Ethereum is currently changing hands around $2,066 following a 6% decline spanning Wednesday through Thursday, putting the $2,050 support zone back in focus. Since the beginning of 2026, the asset has shed 31% of its value.
This downturn mirrors a wider risk-averse sentiment across financial markets, partially driven by geopolitical tensions surrounding the US-Israel-Iran situation. During this timeframe, ETH has lagged behind the overall cryptocurrency market capitalization.
Regulatory challenges are compounding the negative pressure. US Senate discussions are centered on potentially prohibiting yield generation for stablecoins stored on centralized platforms. While Coinbase has voiced opposition, banking industry representatives contend that the GENIUS Act already prevents stablecoin issuers from distributing yields directly to token holders.
The Financial Action Task Force recently urged countries to strengthen stablecoin regulations, expressing concerns that peer-to-peer transfers and self-custodial wallets complicate the monitoring of questionable transactions.
ETF Redemptions and Subdued Futures Activity Indicate Weak Investor Interest
Spot Ether exchange-traded funds listed in the United States have recorded $298 million in net withdrawals starting March 18, marking six straight trading sessions of outflows. The native staking return of 2.8% hasn’t been sufficient to attract risk-on capital.
Ethereum futures contracts are showing a 2% annualized premium relative to spot prices. During balanced market conditions, this metric typically ranges from 4% to 8%. The present measurement indicates that bullish traders lack strong conviction.
Weekly trading volume across Ethereum decentralized exchanges currently stands at $9.4 billion. This represents roughly a 50% reduction from levels observed during the final quarter of 2025. Diminished on-chain engagement continues to suppress demand for ETH in its utility capacity.
Technically, ETH is positioned beneath its 20, 50, 100, and 200-day exponential moving averages. The Relative Strength Index remains below neutral territory, while the MACD indicator reflects deteriorating momentum. Critical support exists in the $2,000–$2,050 zone. Should this range fail, Ethereum could test $1,800 or potentially $1,750.
Network Engagement Soars While Exchange Reserves Contract
Despite downward price action, Ethereum’s blockchain is experiencing unprecedented user engagement. Weekly active addresses climbed to 3.64 million, establishing a new all-time high with a 97% year-over-year increase and 13% growth over the last month.
Competing networks show considerably lower figures: Polygon PoS registered 2.84 million, Base recorded 1.99 million, and Arbitrum posted 785,000 active addresses.
Ethereum balances on centralized exchanges have fallen to their lowest point since 2016. March 22 alone witnessed $1.67 billion in ETH removed from exchanges in a single 24-hour period, suggesting accumulation patterns rather than distribution pressure.
Institutional acquisition continues steadily. Entities such as BitMine, SharpLink, and The Ether Machine have actively purchased ETH. Large-holder transactions surged from 123 on March 21 to 2,055 on March 24, though activity has subsequently normalized to approximately 239 transactions according to recent data.