
 Poised for Massive Breakout After Years of Consolidation")
Key Takeaways
- DOGE consolidates around $0.094, trapped within a descending triangle pattern since hitting its 2021 all-time high
- Critical resistance zone established at $0.10; successful breach could propel price toward $0.20–$0.30 range
- Elliott Wave interpretation indicates DOGE might be finishing its final corrective wave around $0.093–$0.094
- Technical expert Javon Marks spots hidden bullish divergence pattern pointing to potential $0.44 price level
- Blockchain metrics reveal 60,000–110,000 active addresses daily, indicating consistent network engagement
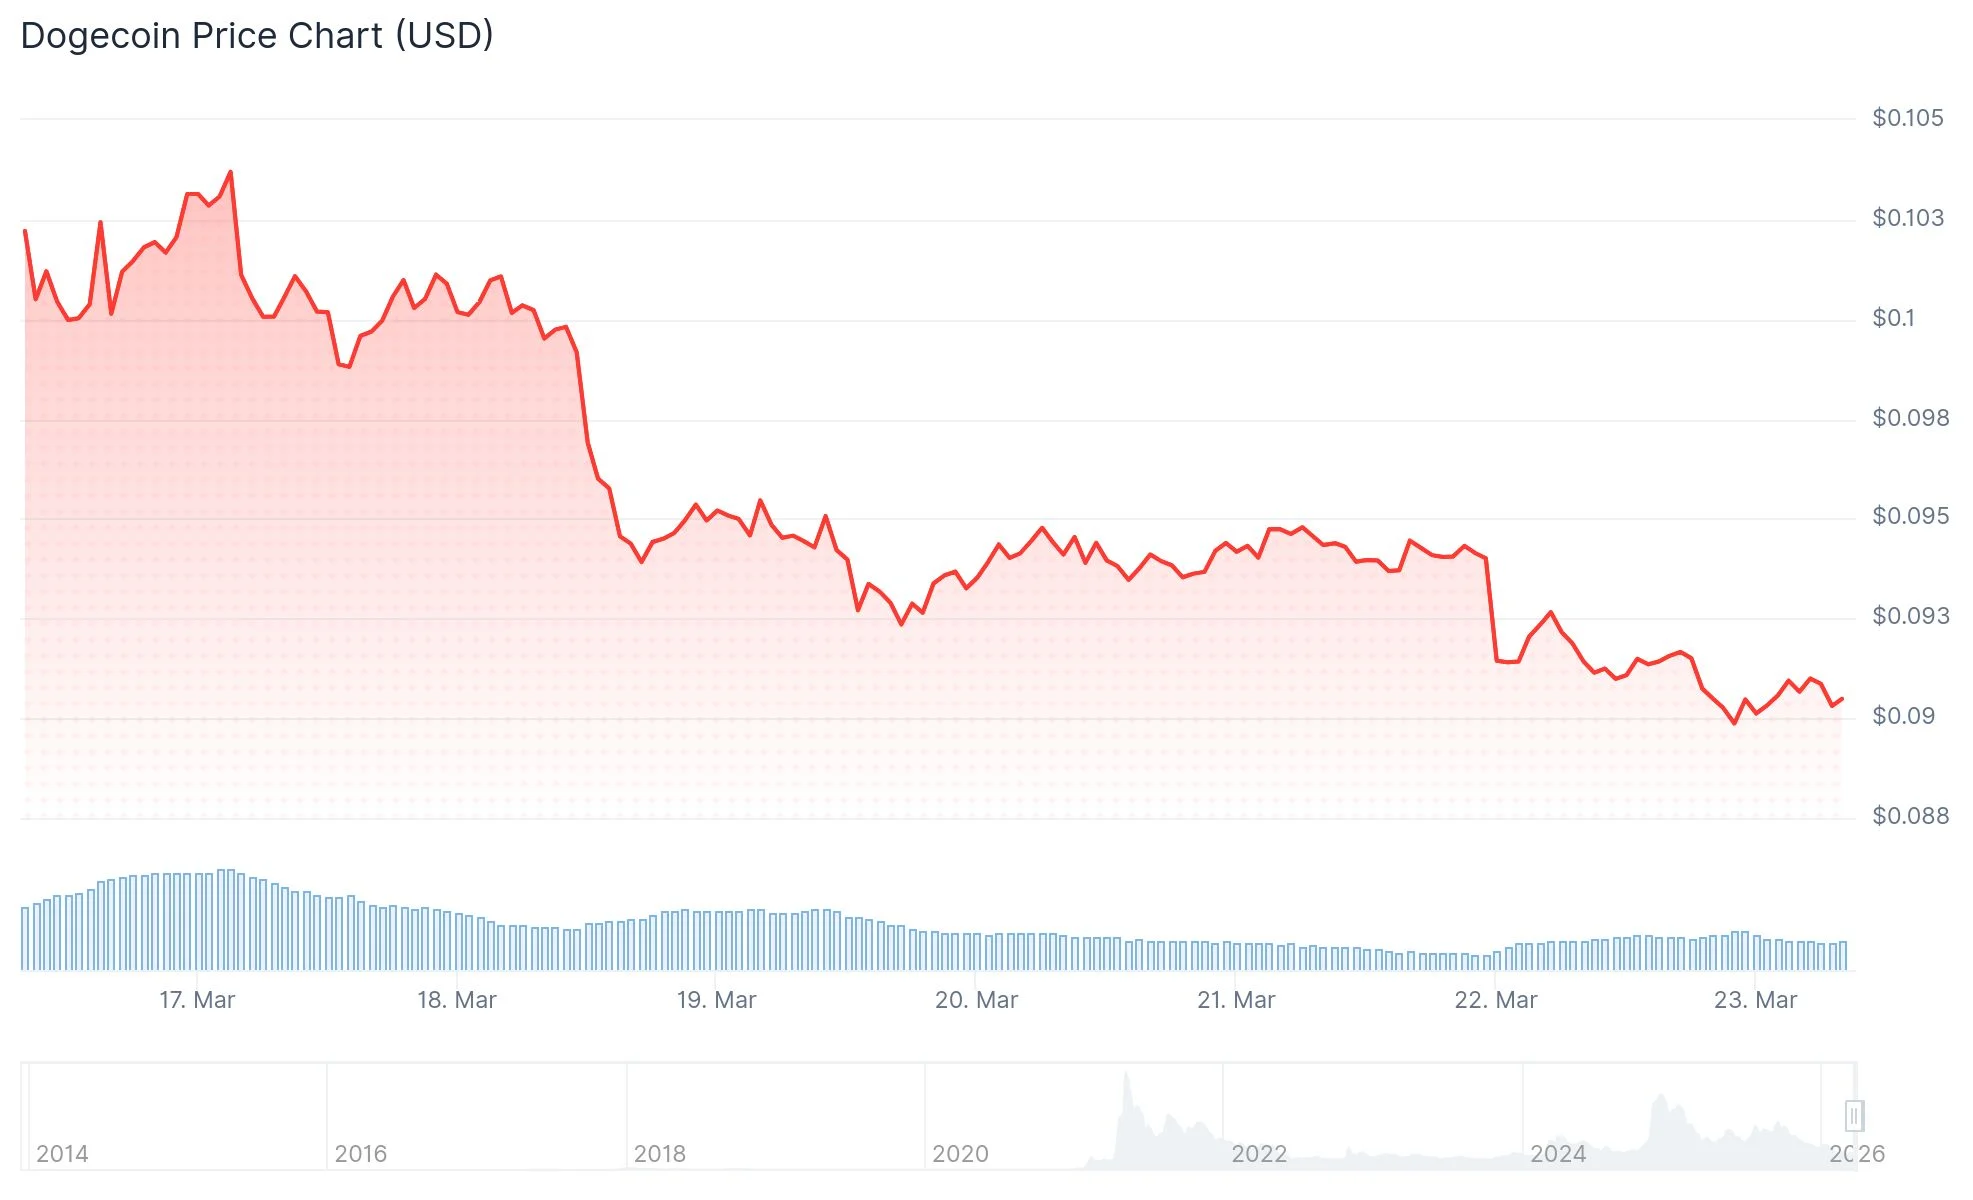
Dogecoin (DOGE) continues to hover around the $0.094 price level as of March 21–22, 2026, confined within a prolonged technical pattern that has captured the attention of cryptocurrency traders worldwide.
Following its peak of $0.73 in May 2021, the popular meme cryptocurrency has experienced a dramatic 73% pullback and has been consolidating ever since. Weekly chart analysis reveals a pattern of progressively lower peaks creating a descending triangle formation, with the bottom range stabilizing between $0.055 and $0.08.
CryptoPatel, a respected technical analyst, drew attention to this configuration, observing that DOGE currently positions itself near the top boundary of this extended compression area. This pattern indicates that volatility has diminished as downward momentum weakens.
[[EMBED_0]]Meanwhile, analyst Crypto Lens identifies a significant 5-year demand area positioned around $0.07867. Historical data shows that similar pattern breakouts previously generated impressive returns of +173%, +180%, and +421%, though it’s important to note that historical performance doesn’t guarantee future results.
Wave Theory Analysis and Divergence Signals
Several market analysts are interpreting the current price action through the lens of Elliott Wave methodology. According to this framework, DOGE appears to be wrapping up the fifth and concluding wave of a corrective downtrend, with Fibonacci projection levels placing the target between $0.093 and $0.094.
Should this corrective wave conclude near present price levels, market participants could begin challenging the resistance barrier at $0.098–$0.10.
[[EMBED_1]]In parallel analysis, Javon Marks has detected a hidden bullish divergence developing within the $0.093–$0.095 zone. The price action demonstrates higher lows maintaining above $0.09, while momentum indicators display lower lows — a technical signal frequently linked to diminishing bearish momentum.
Marks projects that if this divergence pattern materializes as expected, DOGE could experience an explosive rally exceeding 350%, potentially reaching price levels above $0.44 from its current position near $0.093.
Critical Price Thresholds Under Observation
TradingView’s technical indicator aggregates continue to display a “Sell” signal across various moving average timeframes. However, momentum oscillators such as the RSI and Stochastic indicators are registering neutral readings.
Market participants are closely monitoring these crucial price levels:
- Resistance zones: $0.095 and $0.098
- Major psychological barrier: $0.10
- Support areas: $0.092 and $0.088–$0.090
A confirmed weekly candle close above the descending trendline, accompanied by notable volume increases, would represent the strongest validation of a trend reversal. Technical projection models indicate that a decisive move above $0.10 could unlock upside targets within the $0.20–$0.30 range.
Blockchain analytics platforms Glassnode and IntoTheBlock report daily active wallet addresses fluctuating between 60,000 and 110,000, with transaction counts varying from 80,000 to 200,000 per day.
As of March 22, 2026, DOGE was changing hands at $0.09191, reflecting a 2.81% decline over the preceding 24-hour period. The $0.09 support threshold remains the critical structural level that market observers are tracking closely.