

TLDR
- BTC fell beneath $63,000 on February 24, 2026, marking a weekly decline approaching 7%
- Whale wallets are transferring Bitcoin to trading platforms, suggesting more selling ahead
- Trump’s escalation of tariffs from 10% to 15% has reduced appetite for risk assets
- Market sentiment has plunged to extreme fear with the index dropping to 8
- Critical support exists at $60,000; a breach may drive prices toward the mid-$50,000 territory
Bitcoin’s value slipped beneath the $63,000 threshold on February 24, 2026, continuing a downward trajectory that has erased nearly 7% of its value over the past week.
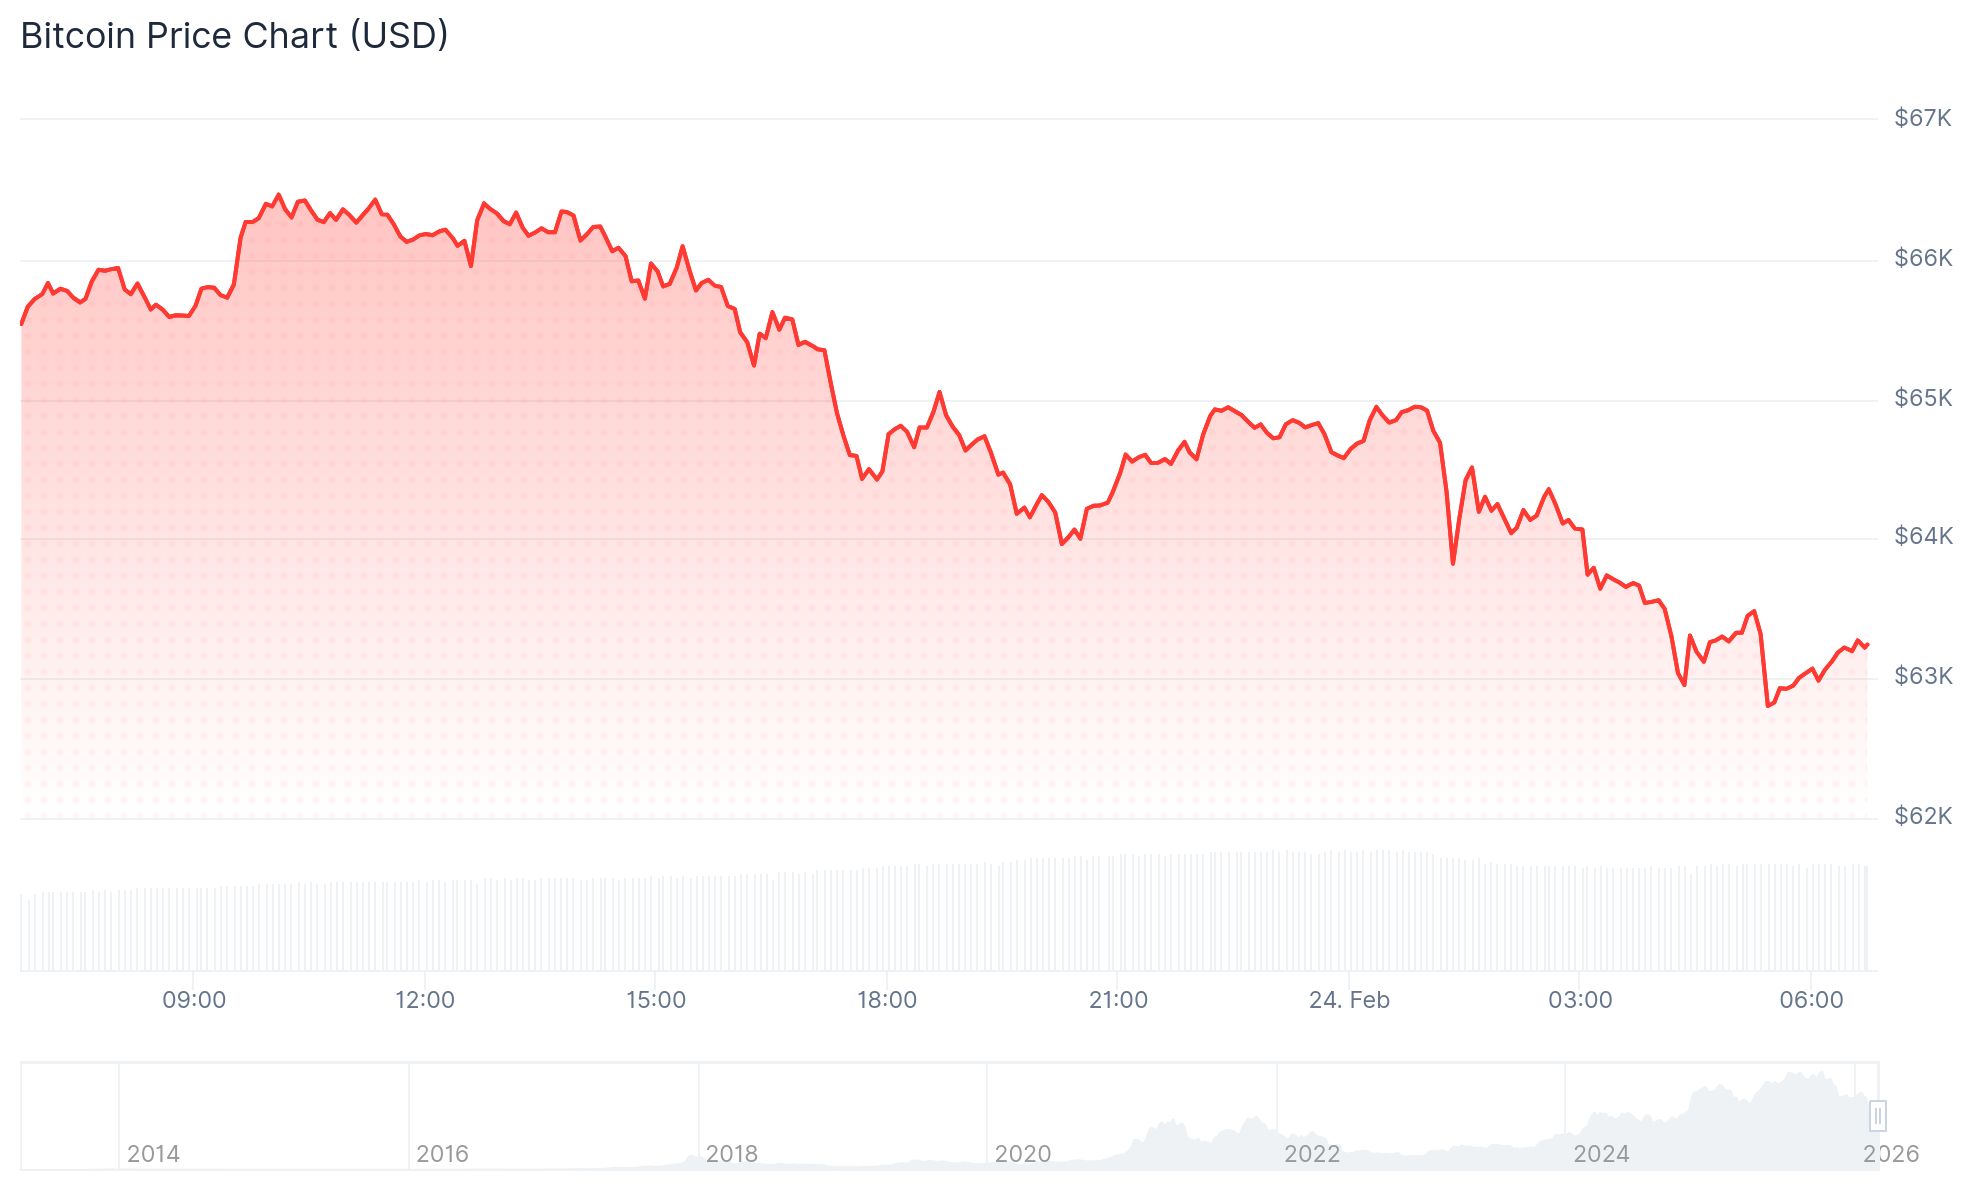
This decline returned BTC to price points not observed since the beginning of February, when the digital asset momentarily dipped below $60,000.
As of this writing, Bitcoin is changing hands near $63,285, reflecting approximately a 4.5% decrease over the last 24-hour period.
Selling momentum has emerged from various sources simultaneously, creating significant headwinds for bullish traders attempting to reverse the downtrend.
Blockchain analytics from CryptoQuant revealed that major Bitcoin holders, commonly referred to as whales, have been relocating their holdings from cold storage to centralized exchanges.
Such movement patterns typically indicate preparation for liquidation, effectively boosting the amount of Bitcoin available for trading in the marketplace.
Meanwhile, purchasing momentum on leading exchanges has remained subdued, with broader cryptocurrency market sentiment continuing to deteriorate.
Tariff Uncertainty Weighs on Markets
President Trump’s trade policy decisions have emerged as a primary catalyst behind the ongoing market downturn.
The U.S. Supreme Court invalidated a substantial component of his initial tariff framework, determining he had exceeded his executive powers.
Following this setback, Trump unveiled a 10% universal tariff on imported goods, subsequently increasing it to 15%, representing the maximum threshold permitted under applicable legislation.
This policy shift created turbulence throughout financial markets more broadly, with stock indices declining as capital rotated toward traditional safe-haven assets like gold, which surged past the $5,200 mark.
Matt Howells-Barby from Kraken drew parallels to tariff-induced market volatility experienced in April 2025.
He emphasized that market participants are monitoring the $60,000 price point with heightened attention. “If that level fails to hold, we could potentially see a move into the mid-to-low $50K range,” he stated.
The Bitcoin fear and greed indicator has collapsed to 8, marking its most pessimistic reading in considerable time, demonstrating pervasive doubt throughout the marketplace.
More than $461 million worth of leveraged cryptocurrency trades were forcibly closed within a 24-hour window, with long positions accounting for 93% of these liquidations.
What Historical Patterns Show
Bitcoin’s extended-term technical framework introduces additional reasons for caution when evaluating future price action.
From a historical perspective, BTC has consistently failed to establish a durable price floor until the 50-week moving average declines below the 100-week moving average.

This technical indicator has reliably identified the conclusion of every significant bear cycle, including those witnessed in 2018 and 2022.
Presently, the 50-week moving average continues to trade substantially above the 100-week counterpart, indicating this bearish crossover remains unrealized.
Market analyst Rashad Hajiyev has projected a period of sideways trading around $50,000, with a possible trough forming near $30,000 during the fourth quarter of 2026.
Projections from CoinCodex suggest Bitcoin could climb to $79,579 by year-end 2026 and potentially reach $166,372 by 2030.
Treasury Secretary Scott Bessent has indicated BTC could establish fresh all-time highs following the passage of comprehensive regulatory framework legislation.